On this page
In September 1893 the Norwegian scientist Fridtjof Nansen did something sailors spend their lives avoiding. He steered his ship into the Arctic pack ice and let it freeze in. He bet that a current was carrying the ice from the Siberian side of the Arctic Ocean towards Greenland, and that a strong ship could ride along. Nearly three years later the ice let the Fram go near Svalbard, and he had his answer.
Why did Nansen freeze the Fram into the ice on purpose?
The clue was a shipwreck. The American ship Jeannette sank off Siberia in 1881. According to the Woods Hole Oceanographic Institution's history of the Fram drift, Inuit found wreckage from it on the southwest coast of Greenland in 1884, three years and 2,900 nautical miles from where it sank. The meteorologist Henrik Mohn argued that the relics pointed to a current flowing from east to west across the entire Arctic Ocean (summary of the Fram expedition).
If wreckage could cross, so could a strong ship. The Fram had a rounded hull so that ice pressure would lift it rather than crush it (WHOI). Its sides were 61 to 71 cm thick (Fram expedition summary). The Fram Museum in Oslo lists 13 men on board, with Otto Sverdrup as captain.
What route did the Fram drift across the Arctic Ocean?
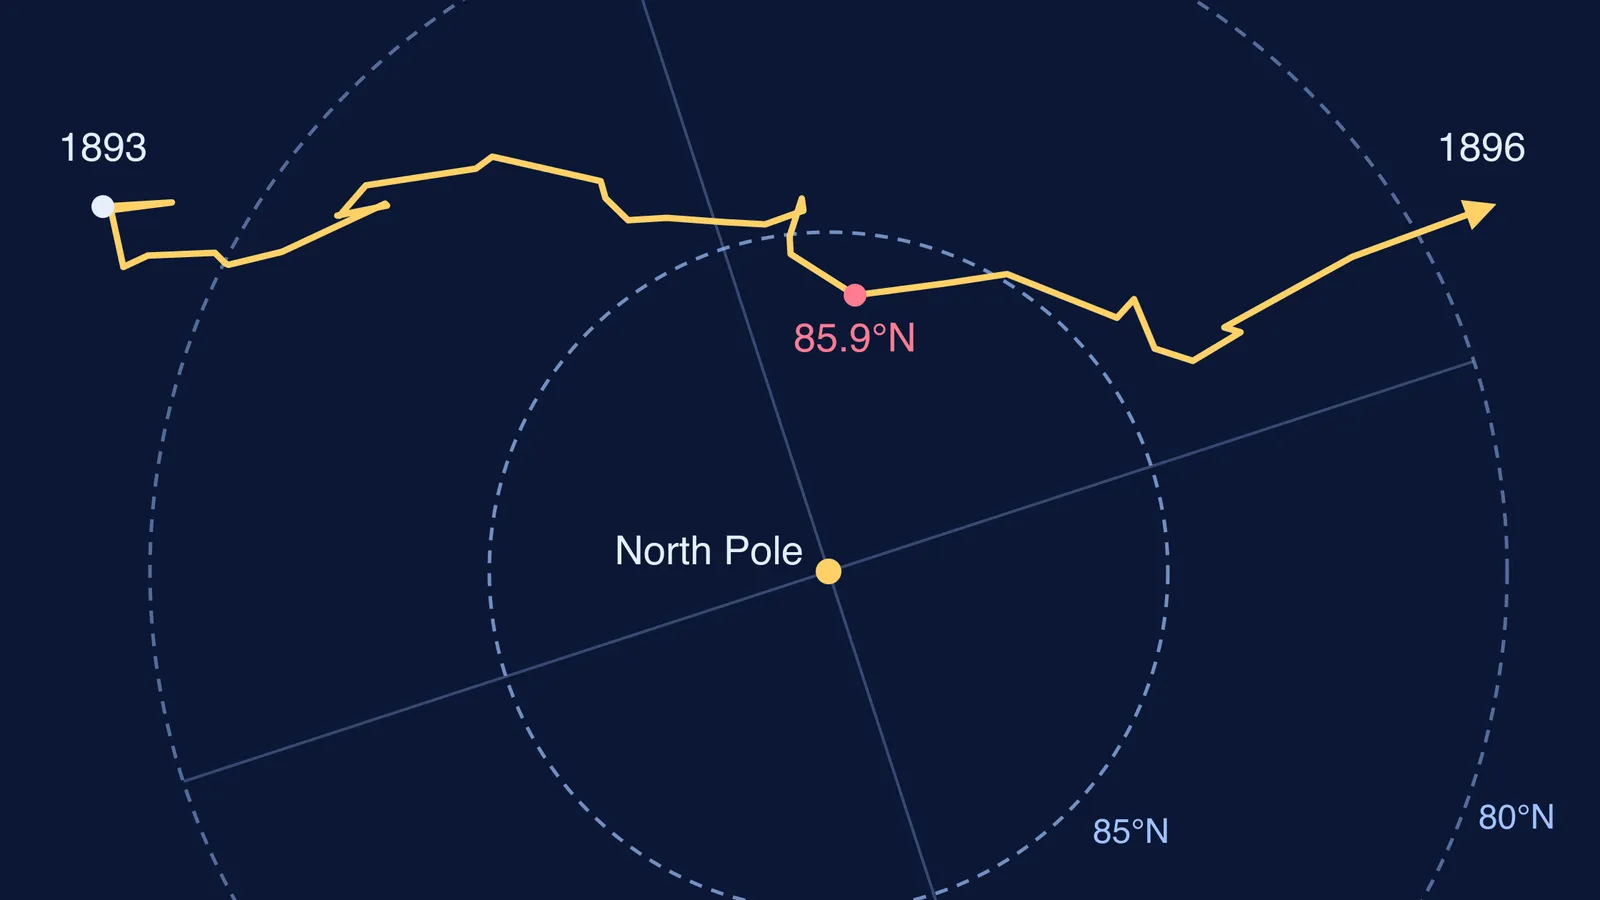
The Fram reached the ice on 22 September 1893 (Fram Museum). On 5 October the crew raised the rudder for safety at 78°49′N, 132°53′E (Fram expedition summary). The map at the top of this page is drawn from the NSIDC trackline of the drift, which logs the ship's position several times a day.
Wind pushed the floes back and forth, so the ship zigzagged. On 14 March 1895 Nansen and Hjalmar Johansen left the ship with dog sledges to try for the pole, and turned back at 86°14′N in early April (Fram Museum). The Fram itself got to just under 86°N in late 1895 (the museum gives 85°57′N; the trackline peaks at 85.92°N). It came out of the ice off northwest Svalbard on 13 August 1896. The University of Alaska Fairbanks Geophysical Institute puts the drift at 1,045 days.
What did the drift prove about Arctic ocean currents?
There is a transpolar drift. The Fram confirmed that ice crosses the Arctic from the Siberian side, as the Jeannette wreckage had hinted (WHOI).
The Arctic is a deep ocean. Soundings of 1,800 m, then 2,700 m and 3,700 m showed there was no hidden land mass nearby (Fram expedition summary).
Ice does not simply follow the wind. Nansen saw the ice drift 20° to 40° to the right of the prevailing wind (oceanography notes, University of Las Palmas).
Nansen suggested that Vagn Walfrid Ekman work out the cause mathematically, and Ekman's 1905 paper on Earth's rotation and ocean currents explained it (Encyclopedia.com entry on Ekman). That idea became the Ekman spiral of wind-driven currents, built on the sideways force Gustave Coriolis described. Measuring such flows later got its own unit, the sverdrup.
How does a Nansen bottle work?
Studying currents needs water and its temperature from a known depth, and Nansen also designed a sampling bottle for the job. The INCOIS oceanography notes, from India's ocean information centre, describe how it works:
Bottles are clamped open along a wire and lowered into the sea.
When the target depth is reached, a metal weight called a messenger slides down the wire and releases the top clamp, so the bottle turns over and seals its water inside.
As it turns, that bottle releases a second messenger, which slides down to trip the next bottle deeper down.
Up to three reversing thermometers on each bottle's frame turn over with it, holding the temperature at that depth.
Worked example: how fast did the ice carry the Fram?
You can check the drift speed with Class 11 tools. Take two positions from the NSIDC trackline: 78.03°N, 135.31°E on 22 September 1893, when the Fram reached the ice, and 80.00°N, 12.00°E on 13 August 1896, when it came out (the log rounds its last positions to whole degrees).
Use the spherical law of cosines: cos d = sin φ1 sin φ2 + cos φ1 cos φ2 cos Δλ.
Put in φ1 = 78.03°, φ2 = 80.00° and Δλ = 123.31°. You get cos d ≈ 0.9634 − 0.0198 = 0.9436, so d ≈ 19.3°.
Earth's mean radius is 6,371 km (NASA Earth fact sheet), so one degree of arc is 2π × 6,371 ÷ 360 ≈ 111.2 km, and 19.3° ≈ 2,150 km.
Divide by the 1,045 days of drift: about 2.1 km a day, or roughly 86 m an hour.
Earth's sideways push is easier to see than to read, which is what the interactive simulations in the Fermi Simulation Lab are for. If distance and displacement still blur together, the Fermi Concept Library gives each concept its own lesson.
Try the sum above with other dates from the trackline to feel how slow, and how patient, the drift was.