
On this page
Where do the numbers on a nutrition table come from? For British food, much of the answer is two scientists who met in a London hospital, measured what foods contain, wrote it down, and then tested their conclusions by eating them.
Who were Elsie Widdowson and Robert McCance?
Elsie Widdowson (1906–2000) was a postgraduate student of dietetics when she met Robert McCance in the kitchens of King's College Hospital in 1933. He was head of the hospital's biochemical laboratory, according to King's College London. The Royal College of Physicians tells how it started: she told him he was using the wrong methods to measure the sugar in apples. That began a partnership of 60 years, and she was elected a Fellow of the Royal Society in 1976.
What is McCance and Widdowson's The Composition of Foods?
The Chemical Composition of Foods, published in 1940, gave the first complete nutritional tables for British foods (Royal Society). A food composition table is a list of foods with the measured amount of each nutrient in them: energy, protein, fat, sugars, minerals, vitamins.
The book's seventh summary edition, published in 2015, covers almost 1,200 foods commonly eaten in the UK (Quadram Institute). The full digital version, the Composition of Foods Integrated Dataset, is published on GOV.UK and was last updated with a new dataset and user guide in March 2021 (GOV.UK).
India has its own version. The Indian Food Composition Tables 2017, from ICMR's National Institute of Nutrition, include nutrient data for 528 raw foods, averaged from six regions of the country (Current Developments in Nutrition, 2024).
How did they test the wartime diet on themselves?
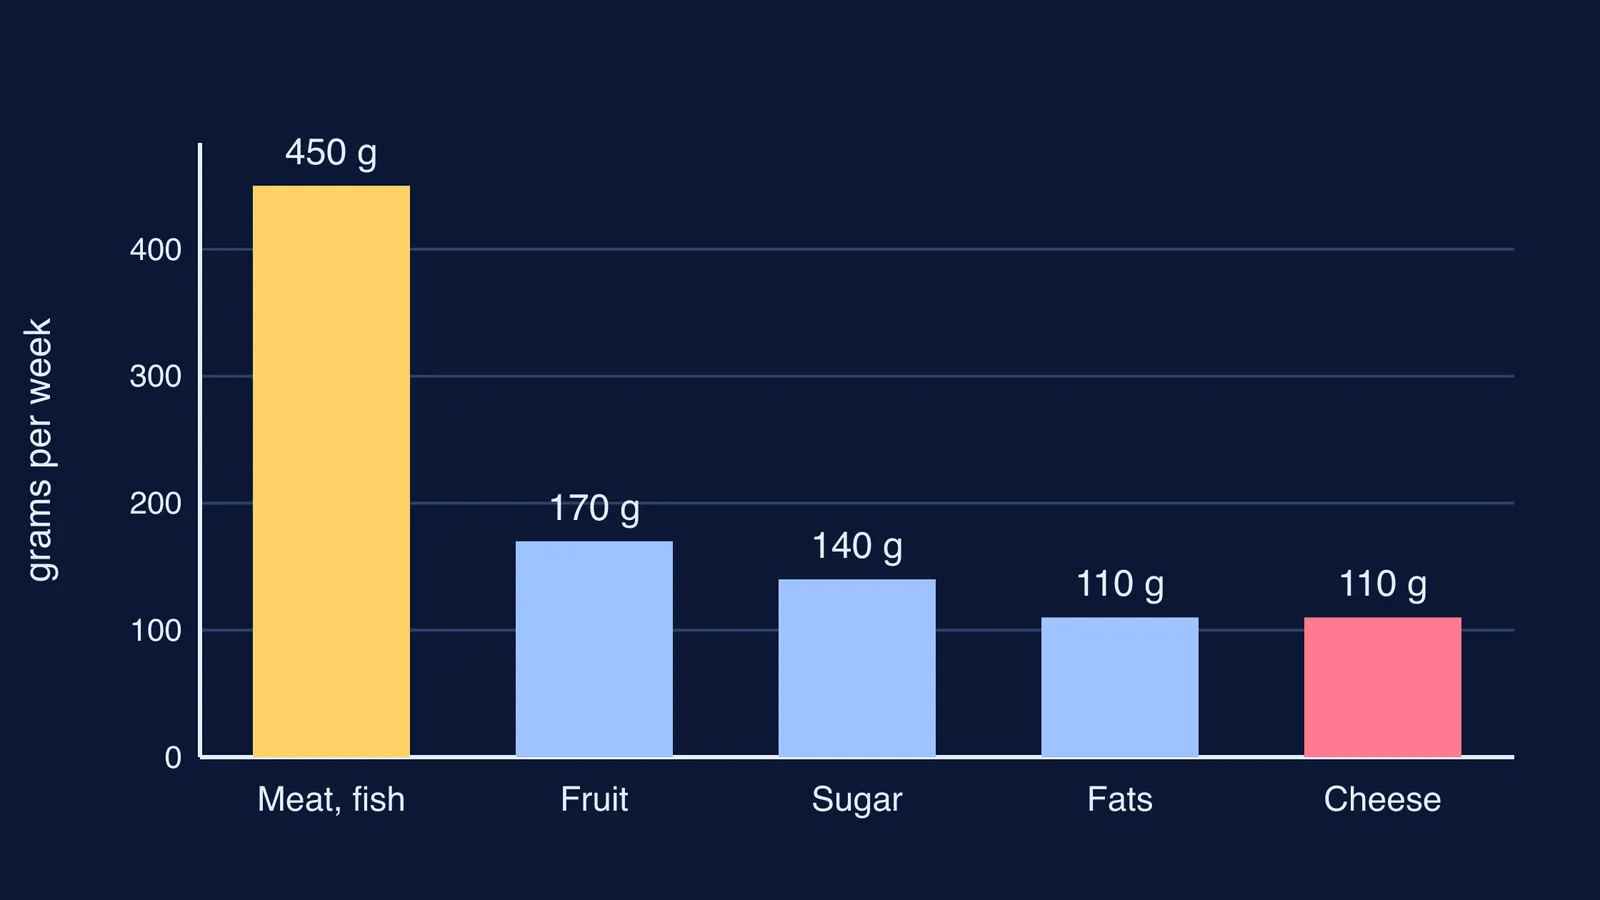
In wartime the question was whether people could stay healthy on the foods Britain could still supply. McCance, Widdowson and five other volunteers planned to eat a proposed ration for three months (Royal Society). Each week they had:
1 lb (about 450 g) of meat and fish
5 oz (about 140 g) of sugar
4 oz (about 110 g) of fats and 4 oz of cheese
one egg and 6 oz (about 170 g) of fruit, as long as it was not imported
a quarter pint of milk a day
as much bread and as many vegetables as they wanted
Still on the rations, they tested their fitness with long walks in the Lake District over the winter of 1939–40. The RCP profile says that on their longest day they covered 36 miles with 7,000 feet of climbing.
It was not their only self-experiment: in 1938 they injected themselves with strontium lactate, and both had severe fever reactions (RCP).
Why did Britain add calcium to bread?
A bread-heavy diet raised a chemistry question. The key finding, as the UK Kidney Association's obituary of McCance puts it, was that phytate (phytic acid) in brown flour interfered with calcium absorption, and that adding calcium carbonate, or chalk, to the flour overcame the problem. In 1941, based on their advice, the government brought in a law to make the fortification of bread with calcium compulsory (Royal Society).
The full results appeared in 1942 in The Journal of Physiology, in Mineral metabolism of healthy adults on white and brown bread dietaries and a follow-up on dephytinized bread. This is the same kind of story as how Takaki Kanehiro beat beriberi in Japan's navy with diet and how Joseph Goldberger proved pellagra was a diet disease: careful measurement turned into a rule for a whole country.
If an idea like this from your chemistry or biology syllabus feels fuzzy, the Fermi Concept Library has a lesson for each concept in chemistry and biology and shows where it fits in the map.
How do you read a food composition table?
Try it with the Royal Society's ration figures above. Turn weekly amounts into daily ones by dividing by 7:
Meat and fish: 450 g ÷ 7 ≈ 64 g a day.
Sugar: 140 g ÷ 7 = 20 g a day.
Fats: 110 g ÷ 7 ≈ 16 g a day, and the same for cheese.
Fruit: 170 g ÷ 7 ≈ 24 g a day.
So little fat and sugar meant most of the food had to be bread and potatoes, which is why the Royal Society account quotes them calling the diet rather filling.
To use a table, the rule is: nutrient in your portion = value per 100 g × your portion in grams ÷ 100. For practice, suppose a flour is listed at 10 g of protein per 100 g (a made-up round number). A 60 g portion then gives 10 × 60 ÷ 100 = 6 g.
Before you trust a number, check three things:
the basis: per 100 g, per serving, raw or cooked
the units: g, mg or µg, kcal or kJ
the source: a national table such as IFCT or CoFID, not a random website
For that story, see how Marcellin Berthelot built the bomb calorimeter. And if per-100 g conversions keep tripping you up in exam questions, the Fermi Problem Library has worked problems with a step-by-step solver that explains the reasoning rather than printing an answer.