On this page
Chapter 2 of NCERT's Class 12 Fundamentals of Human Geography asks why people crowd into some places and leave others nearly empty. This guide covers distribution, density, growth and the demographic transition, with worked numbers for the board exam.
How is world population distributed?
Population distribution is the way people are spaced over the earth's surface, according to NCERT's Class 12 chapter on world population.
Broadly, 90 per cent of the world's population lives on about 10 per cent of its land area, the chapter says. The 10 most populous countries hold about 60 per cent of the world's people, and six of those countries are in Asia.
NCERT sorts the reasons into three groups:
Geographical factors: fresh water, flat land, a comfortable climate and fertile soils. The Ganga plains are among the most crowded areas on earth; the Himalayas are thinly settled.
Economic factors: minerals, cities and industry draw workers, as in the Katanga-Zambia copper belt and Japan's Kobe-Osaka region.
Social and cultural factors: places of religious or cultural importance attract people; unrest pushes them away.
How do you calculate population density?
Population density is the ratio of people to land area, usually measured in persons per sq km: density = population ÷ area (NCERT).
Worked example, with made-up numbers: a plains district of 2,500 sq km has 20,00,000 people, so its density is 20,00,000 ÷ 2,500 = 800 persons per sq km. A hill district with the same 20,00,000 people spread over 10,000 sq km has 200 persons per sq km. In a long answer, follow the number with the reason: flat land and water in one, slopes and thin soils in the other.
If the basics feel shaky, our Class 8 guide to population density and pyramids is a quick refresher.
How is population growth measured?
NCERT's definitions are worth learning word for word (chapter PDF):
Natural growth = births − deaths.
Actual growth = births − deaths + in-migration − out-migration.
Crude birth rate (CBR) = live births in a year ÷ mid-year population × 1,000.
Crude death rate (CDR) = deaths in a year ÷ mid-year population × 1,000.
Worked example: an imaginary town of 2,00,000 people records 4,000 births, 1,400 deaths, 1,000 people moving in and 600 moving out in a year.
CBR = 4,000 ÷ 2,00,000 × 1,000 = 20 per thousand.
CDR = 1,400 ÷ 2,00,000 × 1,000 = 7 per thousand.
Natural growth = 4,000 − 1,400 = 2,600 people.
Actual growth = 2,600 + 1,000 − 600 = 3,000 people, a growth rate of 1.5 per cent.
Migration has two sides: push factors such as unemployment, unrest and epidemics make people leave; pull factors such as better jobs, peace and security draw them in.
What are the three stages of the demographic transition model?
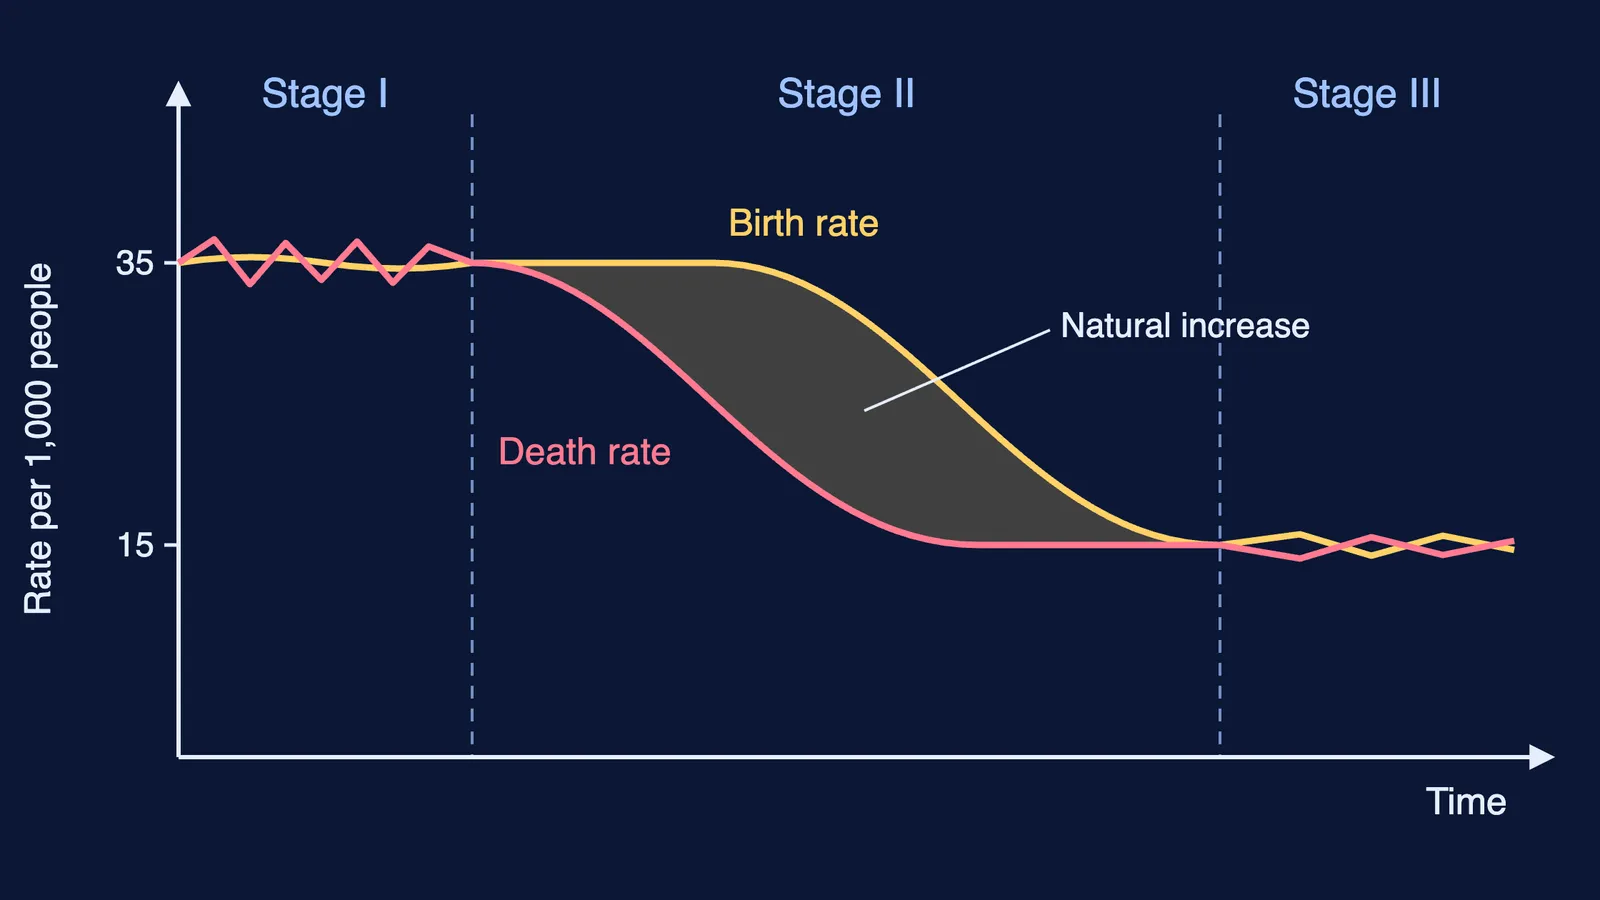
Demographic transition theory says a region's population moves from high births and high deaths to low births and low deaths as society changes from rural, agrarian and illiterate to urban, industrial and literate (NCERT).
Stage I: high fertility and high mortality, slow growth and low life expectancy. Two hundred years ago, every country was here.
Stage II: fertility stays high at first and then declines, while mortality falls with better sanitation and health care. The gap between the two makes growth fast.
Stage III: both rates fall. Population is stable or grows slowly, and people are mostly urban and literate.
The textbook's graph puts Bangladesh and rainforest tribes near the start, Peru, Sri Lanka and Kenya in the expanding middle, and Canada, Japan and the USA in the last stage. For why death rates fell long before birth rates did, read why human population grew so fast.
The UN's World Population Prospects 2024 projects a peak of around 10.3 billion people in the mid-2080s, up from 8.2 billion in 2024. The global fertility rate is 2.25 live births per woman, down from 3.31 in 1990, the same report says. In 63 countries and areas, holding 28 per cent of the world's people in 2024, population peaked before 2024; China, Germany, Japan and Russia are among them. India is in the group likely to keep growing through 2054.
How should you revise this chapter for the board exam?
A 30-minute plan, built on the chapter's NCERT exercises:
Write the four definitions from memory: distribution, density, natural growth and actual growth.
Redo both worked examples above with your own numbers.
Draw the transition graph from memory: both rate curves, three stages and the shaded natural increase.
Answer one 150-word question from the chapter's exercises, giving an example country for each stage.
Do the chapter's map skill: on a world outline map, mark the countries of Europe and Asia with a negative growth rate.
For where India's own figures come from, see how India's census counts people. If you are not sure where to begin, Fermi's AI tutor can work out what you already know and build a plan for the session, so you sit down to a clear next step.