

On this page
What is the standard deviation of two numbers?
For any two real numbers a and b, the population standard deviation is half their positive difference: σ = |a − b| / 2. In secondary school mathematics and competitive entrance exams like JEE Main, dispersion measures quantify how scattered observations are around their central average, as outlined in the CBSE Senior Secondary Mathematics curriculum. With only two numbers, the span |a − b| represents the complete range of the dataset, which makes the standard deviation exactly half of the range.
Consider an everyday pair: 14 and 26. Their arithmetic mean is (14 + 26) / 2 = 20. The gap between them is |14 − 26| = 12, so the standard deviation is 12 / 2 = 6. If the two numbers are identical, such as 18 and 18, their difference is 0, giving σ = 0. Reviewing what a standard deviation of zero means reinforces this baseline: dispersion vanishes whenever every observation coincides with the mean.
Why does the standard deviation equal half the difference?
The formal proof follows directly from the definition of population variance. Let the two observations be x₁ = a and x₂ = b.
Find the arithmetic mean:
x̄ = (a + b) / 2
Compute each observation's deviation from the mean:
d₁ = a − x̄ = a − (a + b) / 2 = (a − b) / 2 d₂ = b − x̄ = b − (a + b) / 2 = (b − a) / 2 = −(a − b) / 2
Square each deviation:
d₁² = [(a − b) / 2]² = (a − b)² / 4 d₂² = [−(a − b) / 2]² = (a − b)² / 4
Average the squared deviations to find the variance σ²:
σ² = (d₁² + d₂²) / 2 = [(a − b)² / 4 + (a − b)² / 4] / 2 = (a − b)² / 4
Take the positive square root to find the standard deviation:
σ = √[(a − b)² / 4] = |a − b| / 2
You can also confirm this identity using the variance shortcut formula, which calculates variance as σ² = (Σx² / n) − x̄². For two values, the mean of squares is (a² + b²) / 2, while the square of the mean is (a + b)² / 4. Subtracting the two gives [2(a² + b²) − (a² + 2ab + b²)] / 4 = (a² − 2ab + b²) / 4 = (a − b)² / 4, yielding the same concise result.
How does the mean-in-the-middle picture explain the formula?
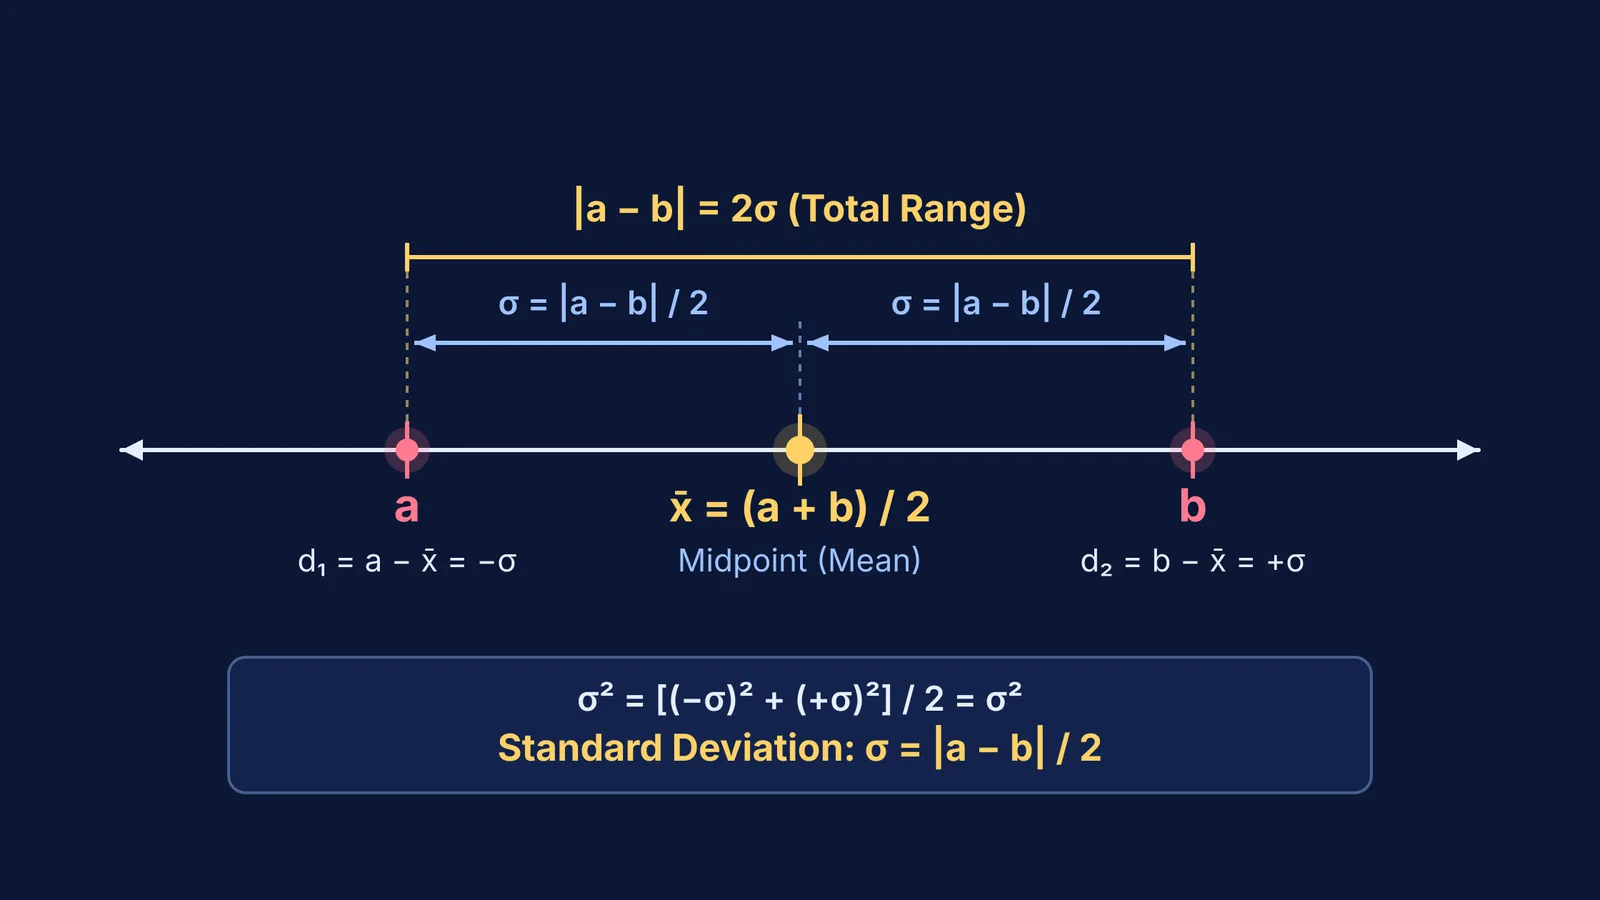
Visualising two numbers on a number line makes this algebra immediately intuitive. The arithmetic mean of two numbers always marks their exact geometric midpoint, acting as the balance point or center of mass.
Because the mean sits precisely midway, the distance from a to the mean equals the distance from b to the mean. Each value is located at a distance of |a − b| / 2 from the center. The standard deviation is the root-mean-square of these deviations. When every deviation in a dataset has the exact same magnitude, taking their squares, averaging them, and extracting the square root simply returns that original distance.
As the NIST Engineering Statistics Handbook highlights in its discussion of scale measures, standard deviation expresses dispersion in the original units of measurement. In a two-value dataset, there are no interior clusters or intermediate points. Every point is both an extreme and the maximum distance away from the center.
Does the formula change for sample standard deviation?
Yes, the formula changes when the two values represent an inferential sample drawn from a larger population rather than the entire population.
In school curricula and JEE Main problems, two numbers are evaluated as a complete population of size n = 2, which uses n in the denominator. However, as noted in OpenStax Introductory Statistics, sample statistics uses Bessel's correction to prevent underestimating variability. Dividing by n − 1 degrees of freedom accounts for using the sample mean instead of the true population mean.
For a sample of size n = 2, the degrees of freedom equal 2 − 1 = 1: s² = (d₁² + d₂²) / (2 − 1) = [2 × (a − b)² / 4] / 1 = (a − b)² / 2
Taking the square root yields: s = |a − b| / √2 ≈ 0.7071 × |a − b|
This distinction explains why variance divides by n in school and n − 1 in samples. The sample standard deviation s is roughly 1.414 times larger than the population standard deviation σ, compensating for the uncertainty of estimating variance from only two data points.
How can you use this identity to check small data sets?
Knowing that σ = |a − b| / 2 turns complex reverse-algebra questions into instant mental calculations during competitive exams.
Suppose an exam problem states that two unknown numbers have an arithmetic mean of 35 and a variance of 25. Standard textbook methods instruct students to set up two simultaneous equations: a + b = 70 and (a − 35)² + (b − 35)² = 50, followed by quadratic expansion. With the two-number identity, you solve it immediately:
The standard deviation is σ = √25 = 5.
Because σ = |a − b| / 2, the half-distance from the mean is 5.
The two numbers must be 35 − 5 = 30 and 35 + 5 = 40.
When preparing for timed exams, students often get bogged down in mechanical algebra during statistics questions. The Fermi Problem Library provides worked problems with a step-by-step solver that explains the reasoning rather than printing an answer, helping you test shortcuts against rigorous proofs. If you find yourself struggling to visualize how algebraic identities connect to statistical spread, Fermi's AI tutor notices where a student is stuck and holds a line of reasoning across a session to strengthen your intuition.


