On this page
One line in Class 12 current electricity connects what electrons do inside a wire to what your multimeter reads: ρ = m/(ne²τ). Understand the τ in it and you can explain why hot metals resist more, why semiconductors do the opposite, and solve the numericals.
What is the relaxation time of electrons?
In a metal, free electrons move about at random and keep colliding with the fixed positive ions, coming out of each collision in a random direction, as the NCERT Class 12 Physics chapter on current electricity describes. With no field applied, their average velocity is zero.
Apply a field E and each electron accelerates at eE/m between collisions, then loses that direction at the next one. Relaxation time (τ) is the average time between successive collisions of a free electron, as defined in the NCERT chapter. Averaging over all electrons gives the drift velocity, v_d = eEτ/m.
How is resistivity related to relaxation time?
The derivation in the NCERT text takes four steps:
Current through area A: I = neAv_d, where n is the number of free electrons per cubic metre.
Substitute v_d = eEτ/m to get current density j = (ne²τ/m)E.
Compare with Ohm's law, j = σE, so conductivity σ = ne²τ/m.
Take the reciprocal: resistivity ρ = m/(ne²τ).
Since m and e are constants, resistivity depends on just two things: how many free electrons there are (n) and how long each one travels between collisions (τ). More electrons or longer free flights mean lower resistivity. For every line of algebra, see our derivation of drift velocity and Ohm's law. The picture of electrons as a gas bouncing off ions goes back to Paul Drude's free-electron model of 1900.
Why does the resistivity of a metal increase with temperature?
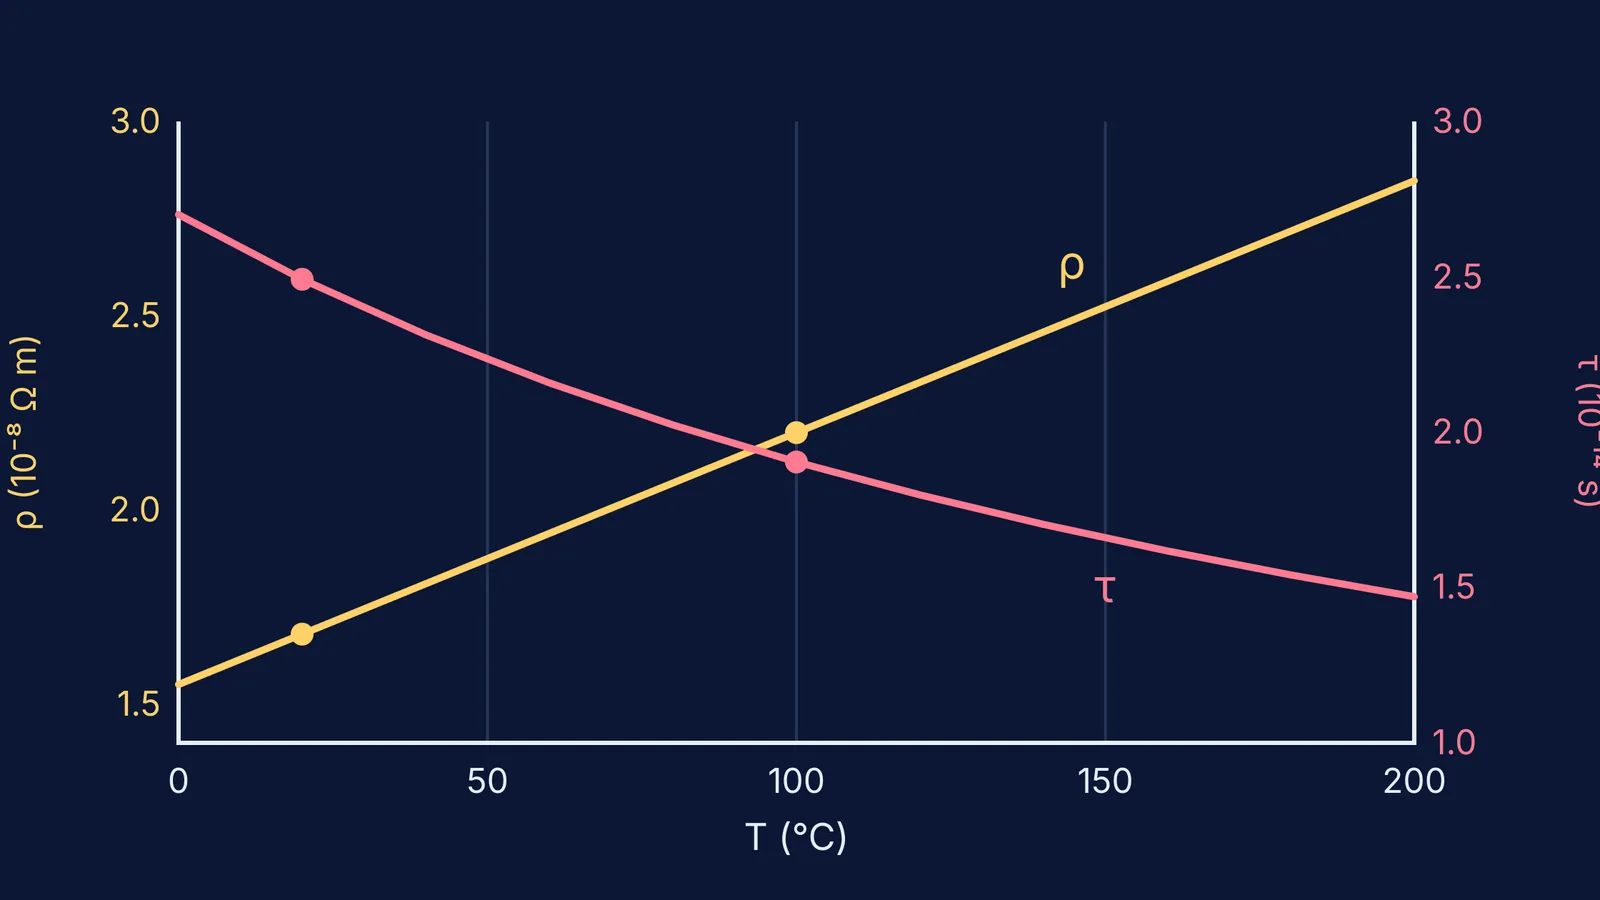
Here is the reasoning from the NCERT chapter, and it is the version to write in a board answer. As temperature rises, the electrons' average speed increases, so collisions become more frequent and τ decreases. In a metal, n does not change appreciably with temperature, so a smaller τ means a larger ρ.
Over a limited temperature range, the same chapter gives ρ_T = ρ_0[1 + α(T − T_0)], with α positive for metals. It also warns that for copper the graph bends well away from a straight line at temperatures much lower than 0 °C.
Semiconductors and insulators are different. Heating them increases n, and NCERT notes that this rise more than makes up for the fall in τ, so their resistivity drops. The same idea explains why a filament bulb's resistance is much higher when hot.
Worked example: how much does τ shrink when copper goes from 20 °C to 100 °C?
The data:
Copper's resistivity at 20 °C is 1.68 × 10⁻⁸ Ω m and its temperature coefficient is 0.00386 per °C, from the HyperPhysics resistivity table.
Copper has about 8.5 × 10²⁸ free electrons per cubic metre, assuming one per atom, from Example 3.1 of the NCERT chapter.
The electron mass is 9.109 × 10⁻³¹ kg (NIST CODATA value), and e = 1.6 × 10⁻¹⁹ C.
The working:
Rearrange: τ = m/(ne²ρ).
At 20 °C: ne²ρ = 8.5 × 10²⁸ × 2.56 × 10⁻³⁸ × 1.68 × 10⁻⁸ ≈ 3.66 × 10⁻¹⁷, so τ ≈ 9.109 × 10⁻³¹ / 3.66 × 10⁻¹⁷ ≈ 2.5 × 10⁻¹⁴ s.
At 100 °C: ρ = 1.68 × 10⁻⁸ × (1 + 0.00386 × 80) ≈ 1.68 × 10⁻⁸ × 1.31 ≈ 2.20 × 10⁻⁸ Ω m.
n is unchanged, so τ scales as 1/ρ: τ ≈ 2.5 × 10⁻¹⁴ / 1.31 ≈ 1.9 × 10⁻¹⁴ s.
So an 80 °C rise makes resistivity about 31% higher and the relaxation time about 24% shorter.
What mistakes cost marks on this topic?
Before a test, check against the NCERT chapter that you do not:
say resistivity rises because n falls. In a metal, n stays almost constant and τ is what changes.
forget to square e in ρ = m/(ne²τ), which throws the answer off by a factor of about 10¹⁹.
confuse τ with the time an electron takes to travel the length of the wire.
use metal reasoning for a semiconductor, where the rise in n wins.
apply ρ_T = ρ_0[1 + α(T − T_0)] far below 0 °C, where it is no longer linear.
forget that mobility is μ = eτ/m, so a shorter τ also means lower mobility.
If a numerical like the one above keeps going wrong at the same step, the Fermi Problem Library has worked problems with a step-by-step solver that explains the reasoning rather than printing an answer. If the gap is the idea of drift or relaxation time itself, the Fermi Concept Library gives each concept its own lesson and shows where it sits in the map.
Next time you see ρ rise on a graph, read it as τ getting shorter.