On this page
A cell labelled 1.5 V does not deliver 1.5 V across a torch bulb. Some of its voltage is lost inside the cell, across its internal resistance, r. The Class 12 potentiometer experiment measures r, and it works because at the balance point no current flows through the galvanometer.
What does the potentiometer actually measure?
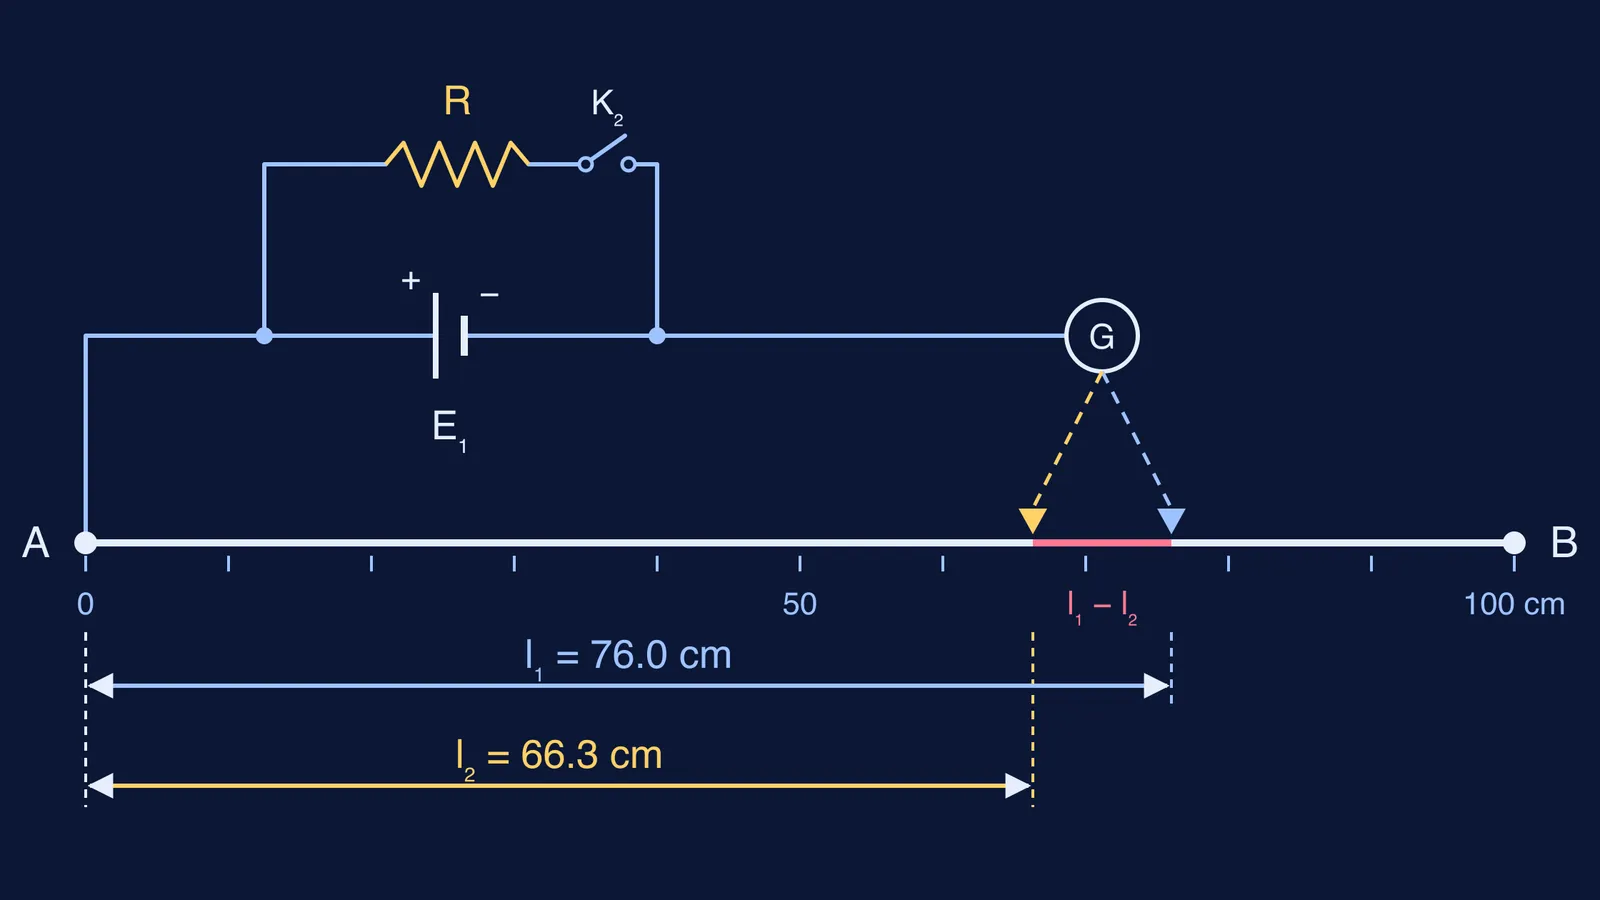
A potentiometer is a long, uniform wire carrying a steady current from an auxiliary battery, so the potential drop along it is proportional to length. When the jockey touches the point where that drop equals the voltage of your cell, the galvanometer shows zero deflection. That is the balance point. Experiment 5 of the NCERT Laboratory Manual for Class 12 Physics uses two balance points:
l1, with the shunt key open: the cell supplies no current, so the wire balances its full emf E.
l2, with a resistance R connected across the cell: current flows through R, so the wire balances the lower terminal voltage V.
How do you get r = R(l1 − l2)/l2?
Following the principle section of the NCERT manual:
With R across the cell, the current is I = E/(R + r).
The terminal voltage is V = IR = ER/(R + r), so E/V = 1 + r/R, which rearranges to r = R(E/V − 1).
Balancing lengths are proportional to voltages, so E/V = l1/l2.
Substitute: r = R(l1/l2 − 1) = R(l1 − l2)/l2.
The potential gradient (volts per centimetre) cancels out. You need neither the auxiliary emf nor the resistance of the wire, only a steady current in the wire.
What do the lab readings look like, worked through?
These are made-up practice readings for a 100 cm wire, not measured data. As the NCERT manual asks, measure l1 at the start and again at the end: say 76.2 cm and 75.8 cm, giving a mean l1 = 76.0 cm. Then take R from 10 Ω down to 5 Ω in steps of 1 Ω and find l2 each time.
R = 10 Ω, l2 = 66.3 cm: r = 10 × 9.7/66.3 = 1.46 Ω
R = 9 Ω, l2 = 65.0 cm: r = 9 × 11.0/65.0 = 1.52 Ω
R = 8 Ω, l2 = 64.1 cm: r = 8 × 11.9/64.1 = 1.49 Ω
R = 7 Ω, l2 = 62.5 cm: r = 7 × 13.5/62.5 = 1.51 Ω
R = 6 Ω, l2 = 60.9 cm: r = 6 × 15.1/60.9 = 1.49 Ω
R = 5 Ω, l2 = 58.4 cm: r = 5 × 17.6/58.4 = 1.51 Ω
The mean is r ≈ 1.50 Ω. Also check that l2 falls as R falls: a smaller R draws more current, so more voltage is lost inside the cell.
The manual also asks for a graph. Rewriting the formula gives 1/R = (l1/r)(1/l2) − 1/r, a straight line when you plot 1/R on the y-axis against 1/l2 on the x-axis. The negative intercept on the y-axis gives 1/r.
Why does a smaller R give a more reliable r?
The NCERT manual says the jockey position can be read within the least count of the scale, ±0.1 cm. In the sample data:
At R = 10 Ω, l1 − l2 is only 9.7 cm. A 0.1 cm slip in each reading shifts it by up to 0.2 cm, about 2%, and r moves between roughly 1.43 Ω and 1.50 Ω.
At R = 5 Ω, l1 − l2 is 17.6 cm. The same slips shift it by only about 1%.
So lower values of R give a bigger, more trustworthy difference. The cost is a larger current drawn from the cell, so follow the manual: close the shunt key, measure quickly and open the key again.
Which precautions and sources of error should you know for the viva?
The precautions listed in the NCERT manual:
The emf of the auxiliary battery must be more than the emf of the cell under test.
Connect the positive terminals of both at the same end, A, and measure every length from A.
Do not disturb the cell during the experiment, or its internal resistance may change.
Close the keys only while taking readings, so the wires do not heat up.
Its sources of error: a wire that is not uniform in cross-section, a finite resistance in the brass strips at the ends, an auxiliary emf that drifts during the experiment, and heating of the wire.
If you can follow the derivation but freeze when a question changes the setup, the Fermi Problem Library has worked problems with a step-by-step solver that explains the reasoning rather than printing an answer. If the gap is in the ideas underneath, such as emf and potential gradient, the Fermi Concept Library gives every physics concept its own lesson.
Before your practical, redo the six calculations above by hand, then plot the graph and compare the two answers.