

On this page
Two potato set-ups turn up in school and college practicals. The potato osmometer shows water moving into a sugar solution through living tissue. The potato strip experiment measures how much water the tissue gains or loses in different solutions. Here is how to run both and what to predict.
How do you set up a potato osmometer?
This version follows a B.Sc. botany practical from Mohanlal Sukhadia University, Udaipur, which uses a 20% sugar solution and about 1 hour of waiting.
Peel a potato, halve it, and trim one half into a flat-based block.
Scoop a cavity from the middle, leaving the base thin but unbroken.
Half-fill it with fresh 20% sugar solution and mark the level with a pin.
Stand it in a dish of water so that about 75% is submerged.
Wait about an hour, then compare the level with the pin.
The handout records that the sugar solution rises: water enters from the beaker through living potato cells acting as a selectively permeable membrane.
Add controls. An NCERT Class 9 exercise, worked through here with answers, uses four potato cups in water: A empty, B with sugar, C with salt, and D, a boiled potato with sugar. Water gathers in B and C. Cup A shows a solute is needed. In cup D, heating destroys the cell membranes, so water does not gather: osmosis needs living cells.
How do you run the potato strip experiment?
The strip method gives you numbers. A plant physiology lab protocol from the College of St. Benedict and St. John's University sets it out like this:
Cut cores with a cork borer and trim them to the same length, about 4.0 cm.
Weigh each core to the nearest 0.01 g.
Put the cores in 10 mL of water or sucrose solution, from 0.1 to 0.8 molal.
Leave them for 1.5 to 2.0 hours, then blot and weigh again.
Work out % change = (final − initial) / initial × 100.
Blot every core the same way, so surface water is not counted as water absorbed.
What happens to potato in salt and sugar solutions?
OpenStax Biology 2e defines osmosis as the movement of free water molecules through a semipermeable membrane according to water's concentration gradient. In a hypotonic solution, water enters plant cells and builds turgor pressure. In a hypertonic solution, water leaves and the membrane pulls away from the cell wall, which is called plasmolysis. In an isotonic solution there is no net movement of water.
So your predictions are:
Distilled water: strips gain mass and feel firm.
Dilute sugar: small gain, small loss or no change, depending on the cell sap.
Strong sugar: strips lose mass and turn floppy.
Salt at the same molal concentration as the sugar: a bigger loss.
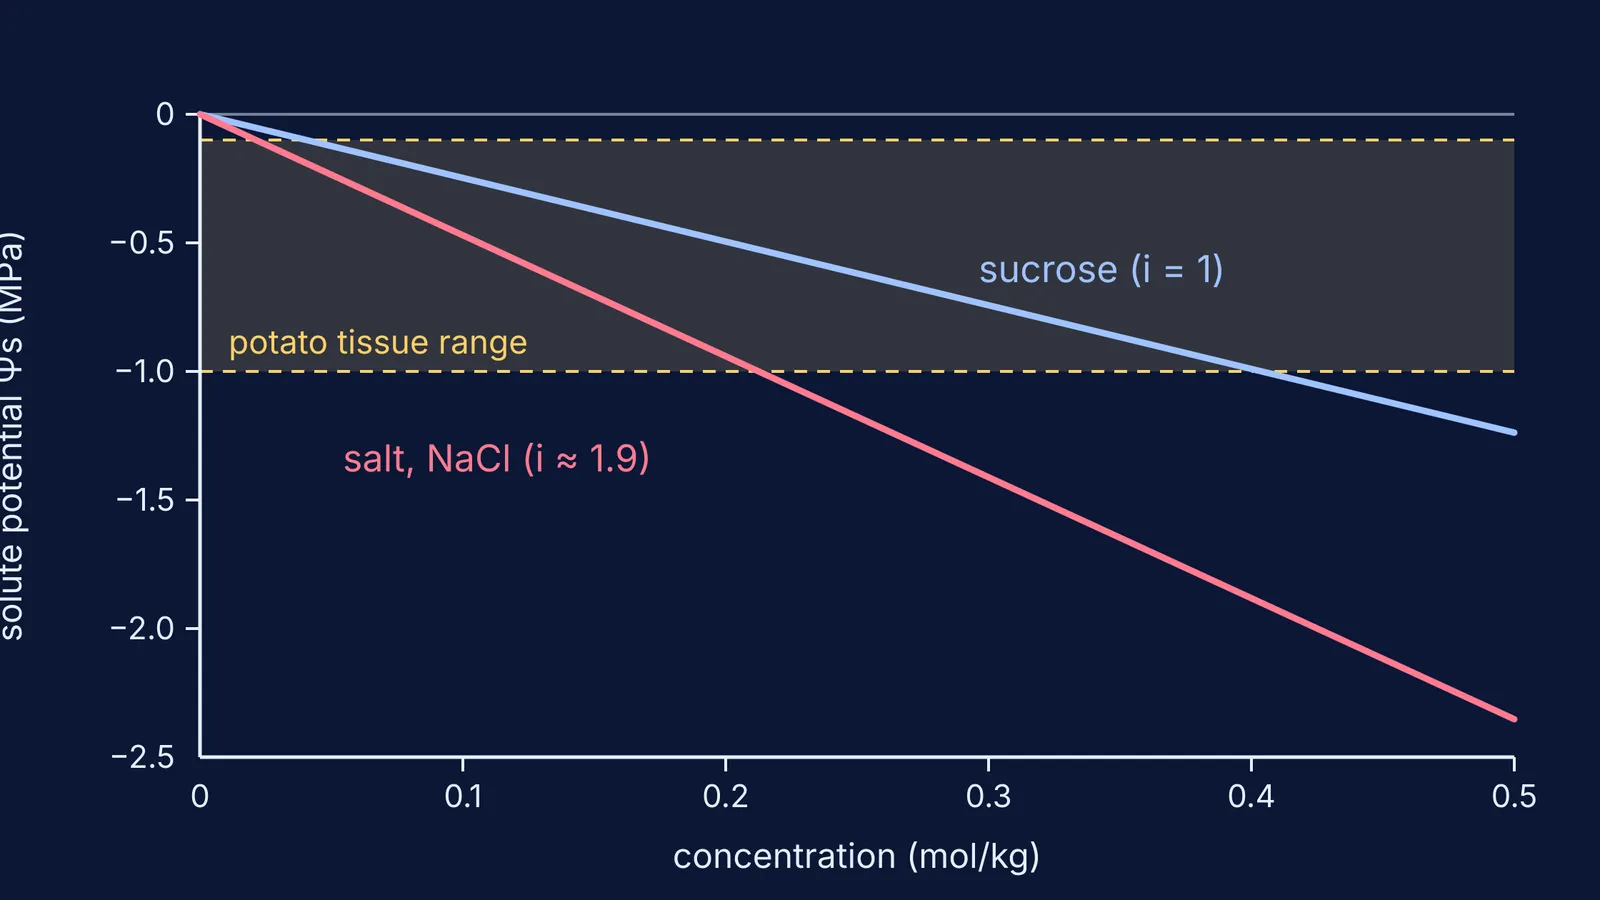
Why? Sucrose stays as whole molecules, but sodium chloride splits into ions. OpenStax Chemistry 2e gives NaCl an ideal van 't Hoff factor of 2 and a measured value of about 1.9 in a dilute solution; for sucrose it is 1.0, per a university plant physiology lab page. So salt acts as if it holds nearly twice as many particles, and pulls water out harder.
How do you find the potato's water potential from your results?
Plot % change in mass against sucrose concentration and draw a best-fit line. The St. Benedict protocol takes the concentration where % change is zero: that solution has the same water potential as the potato. Then use the van 't Hoff equation from the same lab's Chardakov page: Ψs = −miRT, with i = 1.0 for sucrose and R = 0.00831 L MPa mol⁻¹ K⁻¹.
Worked example: suppose your line crosses zero at 0.30 molal and the room is at 25 °C.
Convert the temperature: 25 + 273 = 298 K.
Multiply: 0.30 × 1.0 × 0.00831 × 298 = 0.743.
Add the sign: Ψ = −0.74 MPa.
That sits inside the range the protocol expects for potato tuber cells, −0.1 to −1.0 MPa.
For salt, with i ≈ 1.9, the matching solution would be about 0.30 ÷ 1.9 ≈ 0.16 molal, so 0.30 molal salt should shrink strips more than 0.30 molal sugar.
For practice, theFermi Problem Library has worked problems with a step-by-step solver that explains the reasoning rather than printing an answer.
How should you write the observations and result?
Write a clear chain: what you saw, what it means, and why.
Aim: To demonstrate osmosis using a potato osmometer.
Observation: The sugar solution rose above the pin mark after about one hour; a boiled-potato control should not.
Inference: Water moved from the beaker into the cavity, from higher to lower water potential, across living cells.
Result: Living potato tissue acts as a selectively permeable membrane.
Precautions: Keep the cavity base thin but unbroken, and mark the level before immersing.
For strips, list readings with units, the % change for each solution, and the zero-crossing concentration from your graph. Our post on keeping a lab notebook as a science student helps here.
If solute potential and turgor still blur together, the Fermi Concept Library gives every concept in biology and chemistry its own lesson. For the history, read how a pig's bladder revealed osmosis in 1748; for the process run backwards, see why reverse osmosis needs pressure greater than osmotic pressure.


