

On this page
Why are NCERT photosynthesis figures central to NEET-UG?
The National Testing Agency designs NEET-UG around verbatim statements and graphical figures from the NCERT textbook. In Class 11 Biology's chapter on "Photosynthesis in Higher Plants", ten detailed figures illustrate complex bioenergetic mechanisms. Rather than asking direct definitions, examiners frequently lift these diagrams, blank out two or three crucial labels, or convert spatial orientations into assertion-reasoning pairs.
A single diagram in this chapter often condenses multiple pages of dense biochemical description. When you inspect an illustration through its functional logic—such as how electrons flow uphill against redox potential or where enzymes sit across a membrane—you no longer rely on rote recall under pressure. Reviewing each bioenergetic process in the Fermi Concept Library helps map how electron carriers, membranes, and chemical gradients connect, so you understand the mechanism rather than memorising isolated shapes.
Which NCERT photosynthesis diagrams appear most often in exams?
Across past exam papers, four diagrams appear with notable frequency due to their rich biochemical and quantitative detail:
The chloroplast internal structure: It establishes the structural division of labour between the grana-stroma lamellae membrane system (light reactions) and the soluble stroma matrix (dark reactions). Questions frequently test that stroma lamellae membranes lack Photosystem II and NADP reductase enzyme.
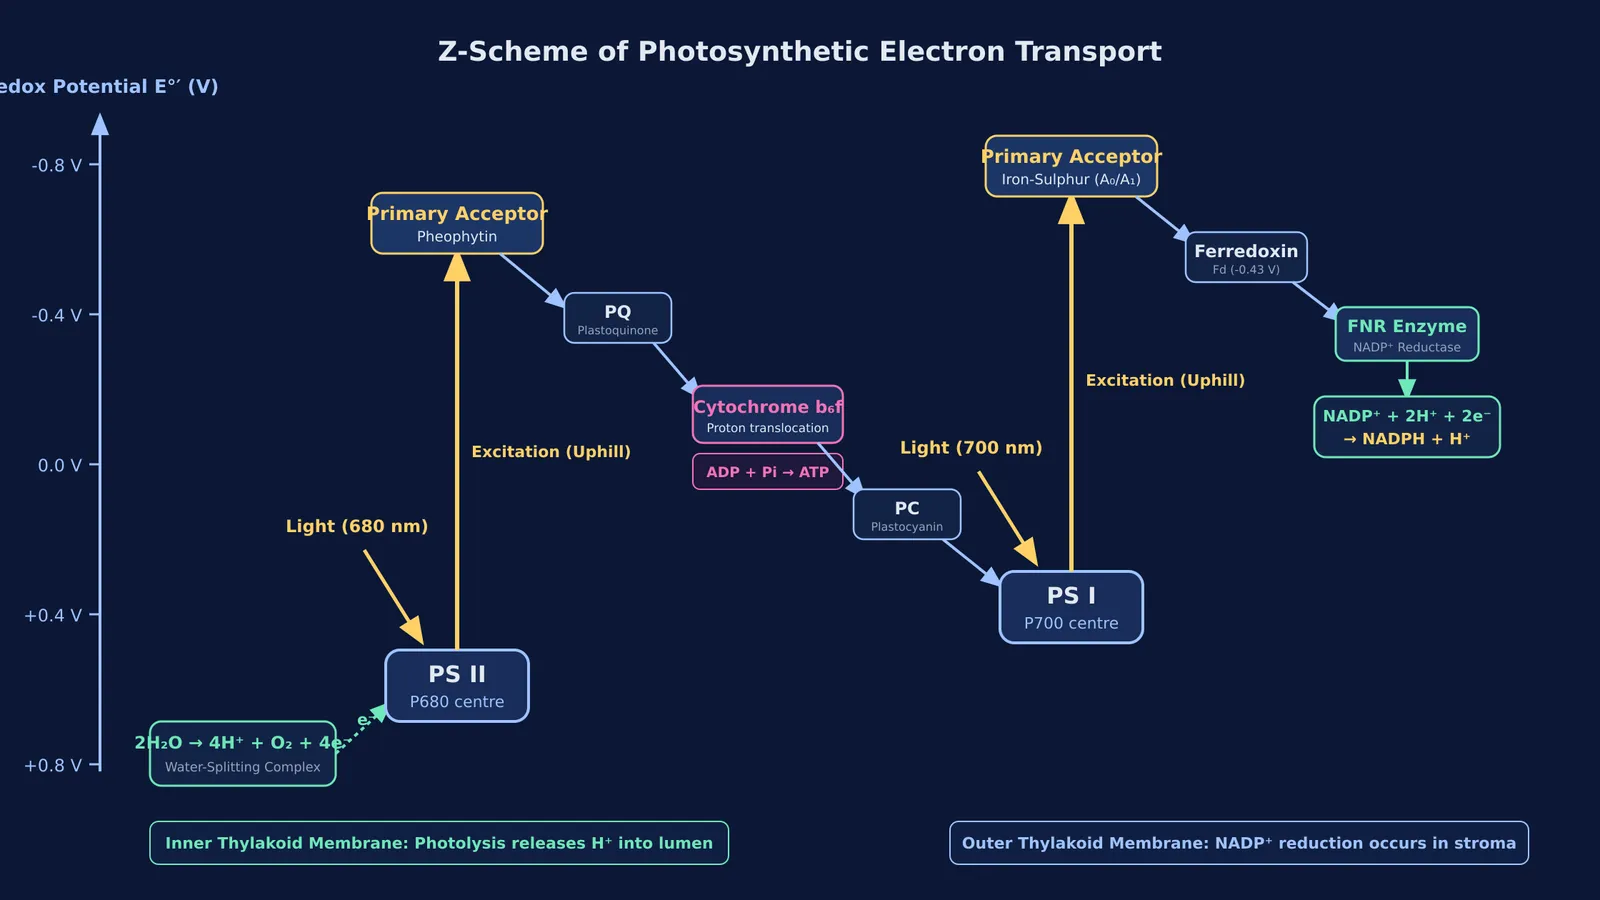
The Z-scheme of light reactions: First formalised on a redox potential scale by Hill and Bendall in 1960, this diagram tracks electrons energized from P680 and P700. For an in-depth breakdown of carrier potentials, read our guide to the Z-scheme electron flow.
ATP synthesis via chemiosmosis: Based on the chemiosmotic hypothesis published by Peter Mitchell in 1961, this diagram highlights the proton gradient generated across the thylakoid membrane. Understand how the CF₀ and CF₁ subunits operate in our analysis of chemiosmosis and ATP synthase.
The Hatch and Slack C4 pathway: This illustrates Kranz anatomy and the spatial separation between mesophyll and bundle sheath cells. It tracks initial carbon fixation by PEP carboxylase, transport of 4-carbon malic or aspartic acid, and decarboxylation near RuBisCO, as explored in our C3 vs C4 plants table.
A fifth visual element is Blackman's 1905 law of limiting factors curve, published in the Annals of Botany. The graph demonstrates that light saturation occurs at 10% of full sunlight, after which carbon dioxide concentration or temperature governs the rate.
What are the most common labelling traps in photosynthesis figures?
Examiners exploit subtle spatial and numerical details that students overlook during casual reading:
Membrane orientation of photolysis: The oxygen-evolving water-splitting complex is situated on the inner side of the thylakoid membrane facing the lumen, not the stromal surface.
Direction of proton translocation: Protons accumulate in high concentration inside the thylakoid lumen, causing lumen pH to drop while the stroma remains relatively alkaline. Protons then flow outward through the CF₀ channel into the stroma, where catalytic CF₁ generates ATP.
Enzyme partitioning in C4 leaves: Mesophyll cells contain PEP carboxylase but completely lack RuBisCO. Bundle sheath cells possess abundant RuBisCO but lack PEP carboxylase.
Stoichiometry of the Calvin cycle: As detailed in the NCERT Class 11 Biology textbook, synthesising 1 mole of glucose requires 6 turns of the cycle, consuming 18 ATP and 12 NADPH. In C4 plants, regenerating PEP demands 2 additional ATP per fixed carbon, bringing the total cost to 30 ATP per glucose molecule.
How should you practise diagram-based questions before NEET-UG?
To achieve complete accuracy on figure-based questions, replace passive scanning with active reconstruction. Use this 4-point diagnostic framework whenever you review an NCERT figure:
Site: Identify the exact cellular or sub-organellar compartment (such as the stromal face versus the luminal face).
Substrates and products: List what enters each step (e.g., ADP, inorganic phosphate, water) and what leaves (ATP, oxygen, NADPH).
Stoichiometry: Note the exact molar ratios of molecules, electrons, or photons involved in the reaction cycle.
Source and driving force: Pinpoint the thermodynamic engine, whether photon absorption, a redox drop, or a trans-membrane proton-motive force.
Working through worked questions in the Fermi Problem Library provides a step-by-step solver that explains the underlying biochemical reasoning rather than just printing an answer. Step-by-step problem solving reinforces structural details by showing how proton gradients and stoichiometry dictate each reaction step.


