

On this page
When you heat a beaker of reacting chemicals by just 10 °C, the rate of the reaction often doubles, a relationship first quantified by Svante Arrhenius in 1889. For decades, students tackling physical chemistry have puzzled over why such a gentle nudge in warmth produces such a substantial leap in pace. The answer does not lie in how hard or how often the particles collide, but in the shape of the Maxwell-Boltzmann kinetic energy distribution.
What does the Maxwell-Boltzmann energy distribution graph show?
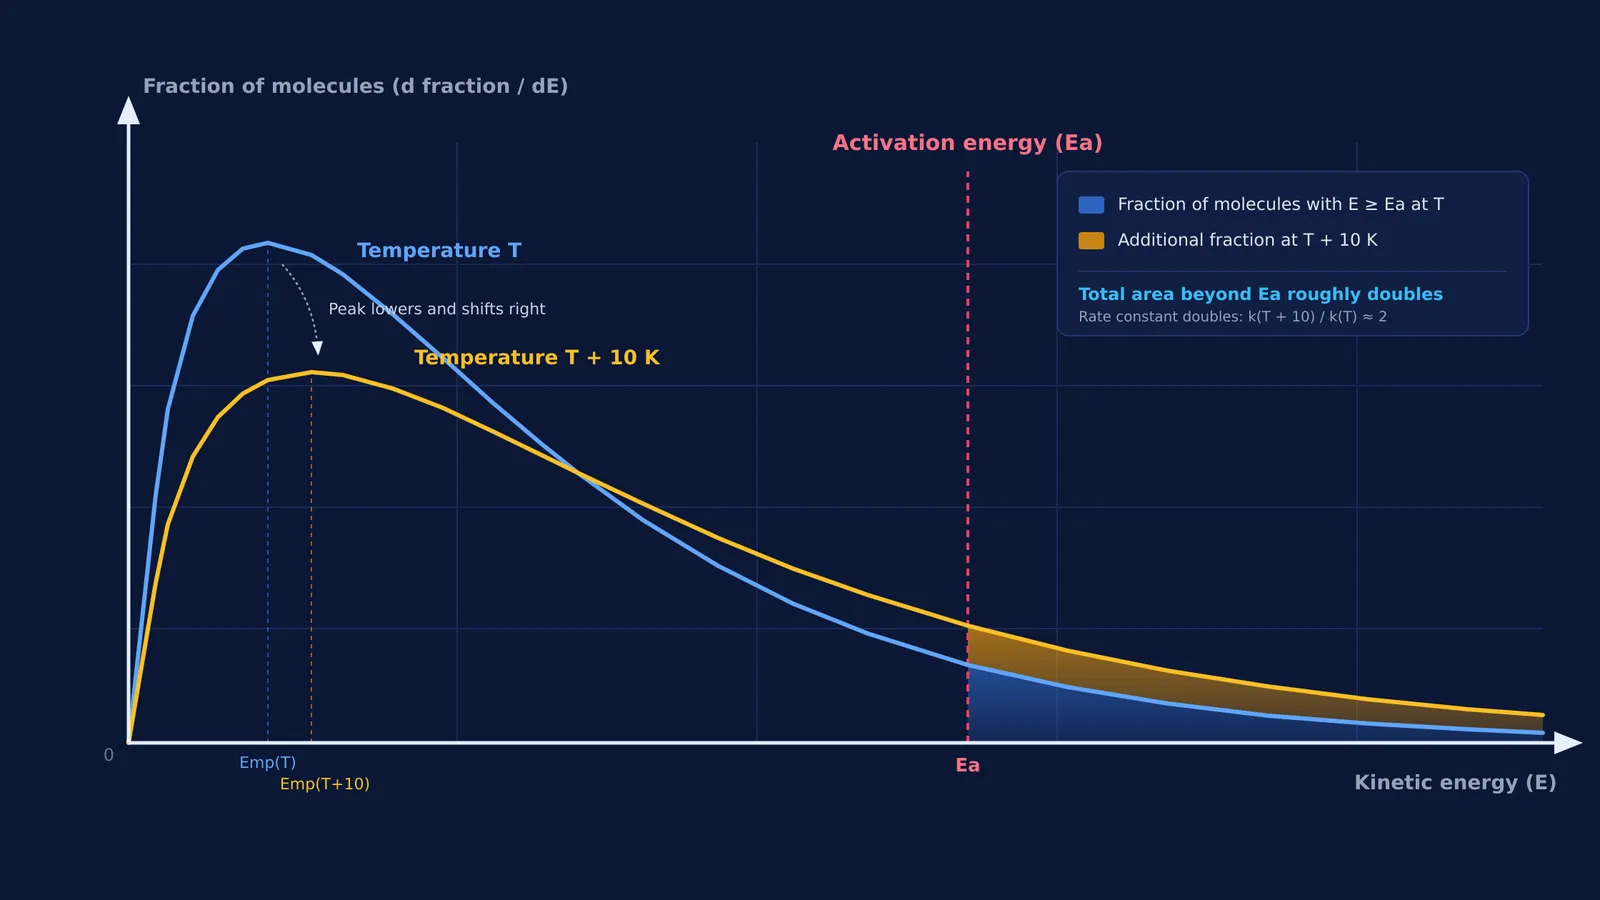
In any gas or liquid solution, molecules do not move at a single uniform speed. Thermal collisions continually transfer momentum between particles, producing a wide spread of kinetic energies. In NCERT Class 12 Chemistry, this statistical spread is represented by the Maxwell-Boltzmann distribution curve, which plots the fraction of molecules possessing a given energy against kinetic energy on the horizontal axis.
The curve begins at the origin because no molecules possess zero kinetic energy during active thermal motion. It climbs steeply to a single crest known as the most probable kinetic energy (Emp), which represents the specific energy level shared by the largest fraction of molecules in the sample. Beyond this crest, the curve tapers into an extended high-energy tail that approaches zero but never touches the axis.
Because every molecule in the container must possess some kinetic energy, the total area under the distribution curve represents the total number of molecules (or a cumulative probability of 1). On this graph, chemists mark a vertical boundary: the activation energy (Ea). This represents the minimum kinetic energy colliding particles must possess to break bonds and initiate a chemical transformation. To see how this relates to reactant ground states, explore the difference between threshold energy and activation energy. Crucially, only the molecules lying in the shaded tail to the right of Ea have enough energy to react when they collide.
Why does the distribution curve flatten and shift to the right when heated?
When the temperature of the system is raised from T to T + 10 K (or 10 °C), the total thermal energy of the molecular ensemble increases. As documented in OpenStax Chemistry, molecules absorb this energy and their average speed rises.
On the graph, this thermal injection causes two simultaneous shifts:
The peak moves rightward: The most probable kinetic energy increases, shifting the highest point of the distribution to higher energy values.
The peak moves downward: The curve broadens and flattens out, meaning a smaller percentage of molecules now share the exact most probable value.
Because the total area under the curve is fixed, any spreading toward higher energies must pull down the peak height. The entire curve reshapes: it becomes lower and wider, redistributing molecules from moderate energies into the high-energy tail. To visualize how molecular distributions reshape across diverse physical conditions, the Fermi Concept Library covers every concept in physics, chemistry, biology, mathematics and computing, each with its own lesson and its place in the map.
How does a 10 °C temperature rise double the area beyond Ea?
The most striking feature of the Maxwell-Boltzmann curve is how sensitive its high-energy tail is to temperature. In his foundational 1889 paper on chemical reaction velocity, Arrhenius (1889) demonstrated that rate constants follow an exponential temperature dependence governed by the Boltzmann factor:
f = e^(−Ea / RT)
Here, f represents the fraction of molecules with kinetic energy equal to or greater than Ea, R is the universal gas constant (8.314 J/(mol K)), and T is thermodynamic temperature.
In typical chemical reactions documented by NCERT Class 12 Chemistry, activation energies range between 50 kJ/mol and 100 kJ/mol. At room temperature (around 298 K), the average thermal energy RT is only about 2.48 kJ/mol. Because Ea is 20 to 40 times larger than RT, activation energy sits far out on the asymptotic tail of the distribution, where the curve's height drops exponentially.
When temperature increases by 10 °C (from 298 K to 308 K), the rightward shift and broadening of the curve pushes a substantial new wave of molecules across the Ea barrier. Even though the overall shape shifts modestly, the shaded area beyond Ea roughly doubles for reactions with an activation energy near 53 kJ/mol. You can measure this barrier directly in the laboratory by extracting activation energy from an Arrhenius plot.
Why doesn't collision frequency explain the doubling of reaction rates?
As classical kinetic principles reviewed in LibreTexts Chemistry/Kinetics/06%3A_Modeling_Reaction_Kinetics/6.02%3A_Temperature_Dependence_of_Reaction_Rates/6.2.03%3A_The_Arrhenius_Law) show, a common misconception among exam candidates is that heating doubles reaction rates because molecules collide twice as often. Kinetic theory disproves this intuition:
Average kinetic energy is directly proportional to temperature (3/2 × kB × T). Heating from 298 K to 308 K increases average kinetic energy by (308 − 298) / 298 × 100% ≈ 3.36%.
Molecular root-mean-square speed and collision frequency (Z) are proportional to √T. Warming from 298 K to 308 K increases collision frequency by √(308 / 298) − 1 ≈ 1.66%.
An increase of less than 2% in collisions cannot explain a 100% surge in reaction speed. The collision frequency contribution is essentially negligible. Instead, nearly the entire acceleration comes from the doubling of the fraction f of collisions possessing sufficient energy to react. You can test how temperature, concentration, and energy barriers interact in collision theory and reaction rates.
How do you calculate the temperature coefficient on exam numericals?
The sensitivity of a reaction to temperature is measured by its temperature coefficient, defined in NCERT Class 12 Chemistry as the ratio of rate constants separated by 10 °C:
Temperature coefficient = k(T + 10) / k(T)
For most ordinary reactions near room temperature, this coefficient lies between 2 and 3. Here is how to verify this mathematically using the two-point Arrhenius formula:
State the parameters: Initial temperature T1 = 298 K, final temperature T2 = 308 K, activation energy Ea = 52.9 kJ/mol (52,900 J/mol), and universal gas constant R = 8.314 J/(mol K).
Apply the integrated Arrhenius equation: ln(k2 / k1) = (Ea / R) × (1/T1 − 1/T2) = (Ea / R) × (T2 − T1) / (T1 × T2)
Compute the temperature difference factor: (308 − 298) / (298 × 308) = 10 / 91,784 ≈ 1.0895 × 10^(−4) K^(−1)
Multiply by Ea / R: Ea / R = 52,900 / 8.314 ≈ 6,362.76 K, giving ln(k2 / k1) = 6,362.76 × 1.0895 × 10^(−4) ≈ 0.6932
Convert from natural logarithm to ratio: k2 / k1 = e^(0.6932) ≈ 2.00
The rate constant doubles precisely because the fraction of molecules with energy above 52.9 kJ/mol doubles. When solving multi-step kinetics numericals or checking ratio steps, the Fermi Problem Library has worked problems with a step-by-step solver that explains the reasoning rather than printing an answer.


