

On this page
To understand how temperature affects reaction rates, chemists use the Arrhenius equation. The equation is k = A e^(-Ea / RT) (Wikipedia).
Here, k is the rate constant, Ea is the activation energy in J/mol, T is the absolute temperature in Kelvin, and A is the pre-exponential factor (Wikipedia). The gas constant R is 8.314 J·K⁻¹·mol⁻¹ (Wikipedia).
How do you find activation energy from an Arrhenius plot?
Because an exponential curve is hard to analyze by eye, we transform the equation into a straight line. Taking the natural logarithm of both sides gives the linear form: ln k = ln A - (Ea / R)(1/T) (Wikipedia).
This matches the standard equation for a straight line, y = mx + c.
The y-axis is ln k (Wikipedia).
The x-axis is 1/T (Wikipedia).
The slope (m) is -Ea / R (Wikipedia).
The y-intercept (c) is ln A (Wikipedia).
By calculating the slope of the resulting straight line, the activation energy can be found using Ea = -m × R (Wikipedia).
A worked example: plotting virtual data
Let us look at a reaction with a high activation energy of 100,000 J/mol to see how the Arrhenius plot works (OpenStax). Because the activation energy is large, a small shift in temperature causes a massive jump in the rate constant.
Here is a step-by-step framework to handle this data:
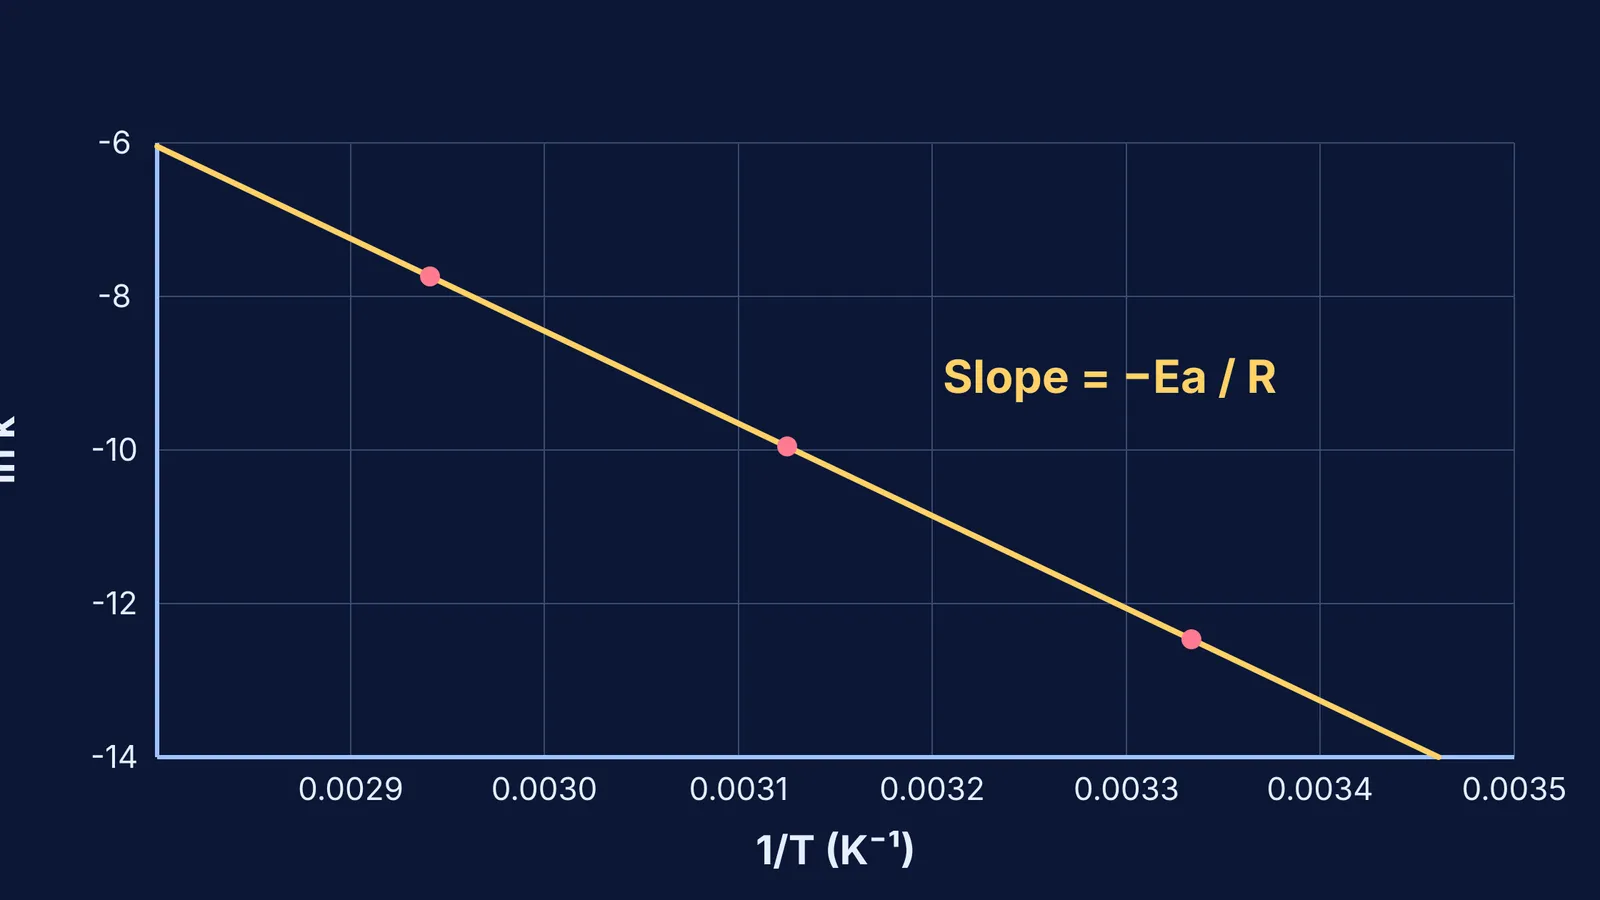
Collect and convert. Suppose you measure the rate constant k at 300 K, 320 K, and 340 K. First, ensure your temperatures are in Kelvin. Calculate 1/T for each point: 0.00333 K⁻¹, 0.00313 K⁻¹, and 0.00294 K⁻¹.
Take the natural log. For the measured rate constants, calculate ln k. At 300 K, if k = 4.0 × 10⁻⁶ s⁻¹, then ln k = -12.42.
Plot the points. Graph ln k on the vertical axis against 1/T on the horizontal axis. You will get a straight line sloping downwards.
Find the slope. Pick two points on your line. Using our data at 300 K and 340 K, the slope is (-7.73 - (-12.42)) / (0.00294 - 0.00333) = 4.69 / -0.00039 = -12,025 K.
Solve for activation energy. Multiply the slope by -R. Ea = 12,025 × 8.314 = 99,975 J/mol, which is 100 kJ/mol (allowing for rounding).
When studying, visualizing exactly how inverse temperature affects the slope helps you avoid common sign errors. The Fermi Simulation Lab has interactive simulations for the ideas that are easier to see than to read. You can change variables and instantly watch the plot respond.
Why does the Arrhenius plot have a negative slope?
The slope is negative because activation energy (Ea) and the gas constant (R) are always positive values. As temperature increases, the value of 1/T decreases. A higher temperature makes the reaction faster, so the rate constant k increases, which means ln k becomes less negative. Moving left on the graph (lower 1/T) leads to higher points on the y-axis, creating a line that points downwards to the right.
This linear method applies across physical chemistry. You will use similar graphical reasoning when Converting PV, PT and VT graphs or calculating the Free expansion of an ideal gas.
How to avoid common mistakes on the exam
When facing Arrhenius plot questions in chemistry exams, students often make predictable errors. Here is a checklist to keep your calculations on track:
Check your temperature units. The Arrhenius equation requires absolute temperature. Always convert Celsius to Kelvin before calculating 1/T. Using Celsius will ruin the linear relationship.
Watch the gas constant. The gas constant R is 8.314 J·K⁻¹·mol⁻¹ (Wikipedia). If your activation energy is requested in kJ/mol, remember to divide your final answer by 1,000.
Do not flip the slope. The slope is -Ea / R, which is a negative number. When you set Ea = -m × R, the two negative signs cancel out, leaving a positive activation energy. If you end up with a negative activation energy, you have likely dropped a minus sign.
Keep enough decimal places. The value of 1/T is usually very small. Rounding 0.00333 to 0.003 can drastically alter your slope. Keep at least three significant figures during intermediate steps.
Why activation energy matters
Activation energy is the minimum energy required to start a chemical reaction. Think of it as a barrier or a hill that molecules must climb over before they can react. A high activation energy means that very few molecules have enough energy to cross the barrier at room temperature.
When you raise the temperature, you give more molecules the thermal energy needed to reach the top of the hill. For a reaction with a high activation energy, even a small increase in temperature dramatically increases the fraction of molecules that can react. This is why the slope of the Arrhenius plot is so steep for these reactions.
Whether you are designing a chemical plant or studying for an exam, finding the activation energy lets you predict exactly how fast a reaction will proceed under new conditions.
Mastering these graphs takes practice. The Fermi Problem Library has worked problems with a step-by-step solver that explains the reasoning rather than printing an answer. This helps you build the habit of checking your units and axis labels before you start calculating.


