On this page
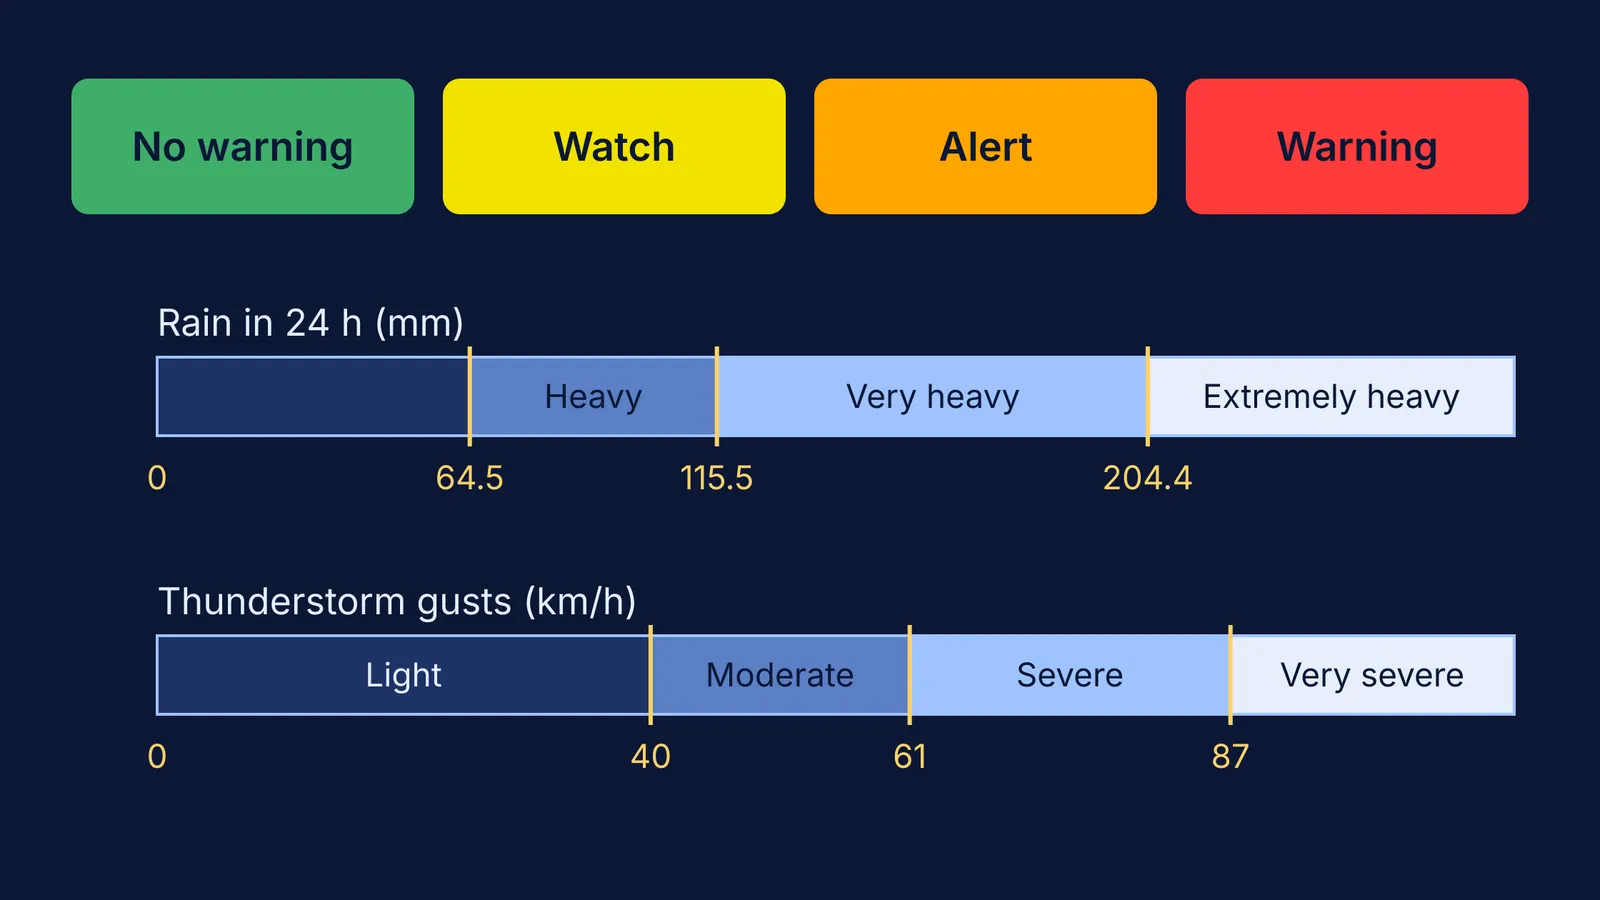
When the India Meteorological Department (IMD) puts your district in orange, it is telling you how ready you should be, not just how much rain will fall. On IMD's district-wise warning map, the legend reads No Warning, Watch, Alert and Warning, shown in green, yellow, orange and red.
What do IMD yellow, orange and red alerts mean?
The legend on IMD's warning maps pairs each colour with an action (IMD press release, 9 July 2023; IMD press release, 22 April 2026):
Green: No Warning. No action needed.
Yellow: Watch. Be updated (the 2026 legend says "be aware"); keep checking the forecast.
Orange: Alert. Be prepared to take action.
Red: Warning. Take action.
The 2026 release notes that action may be taken based on orange and red warnings, and that forecasts get less accurate the further ahead they look. For heat, IMD's FAQ on Heat Wave calls the colours an impact-based warning issued jointly with the National Disaster Management Authority.
What numbers sit behind the warnings?
Rain. IMD defines heavy rain as 64.5 to 115.5 mm, very heavy rain as 115.6 to 204.4 mm, and extremely heavy rain as more than 204.4 mm, measured over the 24 hours to 8:30 am IST (IMD press release, 9 July 2023).
Wind. In IMD's district nowcasts, a moderate thunderstorm has gusts of 41 to 61 km/h, a severe one 62 to 87 km/h, and a very severe one more than 87 km/h.
Heat. In the plains, a station counts towards a heat wave when its maximum reaches at least 40 °C and is 4.5 °C to 6.4 °C above normal; more than 6.4 °C above normal is a severe heat wave. A maximum of 45 °C or more also counts as a heat wave, and 47 °C or more as severe (IMD FAQ on Heat Wave). Hills use 30 °C and coasts 37 °C, and the criteria must hold at 2 or more stations in a sub-division on 2 consecutive days. Our explainer on how IMD defines a heatwave goes deeper.
Heat wave conditions in isolated pockets on 2 days are yellow; a severe heat wave for 2 days, or a heat wave lasting 4 days or more, is orange; a severe heat wave lasting more than 2 days, or more than 6 heat-wave days in total, is red (IMD FAQ on Heat Wave). Same temperature, longer spell, higher colour.
How do you read a warning? Two worked examples
Rain. IMD reported 30 cm of rain at Chandigarh in the 24 hours to 8:30 am on 9 July 2023 (IMD press release, 9 July 2023).
Convert: 30 cm is 300 mm.
Compare: 300 mm is above 204.4 mm, so it is extremely heavy rain.
Scale it: 300 ÷ 64.5 is about 4.7, so it was nearly five times the amount where "heavy" begins.
Picture it: 1 mm of rain on 1 square metre is 1 litre of water (1 m² × 0.001 m = 0.001 m³). A 100 m² rooftop would collect 30,000 litres in that one day, which helps explain why cities flood after heavy rain.
Heat. Say a plains town's normal maximum is 39 °C and today it reaches 44 °C. It has crossed 40 °C and is 5 °C above normal, so it is in the heat wave band of 4.5 °C to 6.4 °C (IMD FAQ on Heat Wave). If nearby stations show the same and it lasts 2 days, IMD's table points to yellow; if it runs 4 days or more, orange.
What should your family do at each colour?
A household plan; the heat actions in brackets come from IMD's FAQ on Heat Wave.
Green: Know where you will check. Bookmark your district on IMD's map.
Yellow: Check the forecast morning and evening. IMD suggests avoiding the sun between noon and 3 pm. (Heat: avoid heat exposure, wear light, loose cotton clothes, cover your head.)
Orange: Charge phones and power banks, store drinking water, and agree on a backup plan for school or exam travel. (Heat: keep cool and drink enough water, even if not thirsty.)
Red: Follow local authorities, skip travel you can postpone, and check on elderly relatives and small children. (Heat: IMD asks for extreme care for vulnerable people.) IMD's advice is to see a doctor if you feel faint or ill in the heat.
Before a big day, check the official notice from the school or exam body, not forwards.
Why does wind speed matter more than it looks?
The force of wind on a wall or tree grows with the square of its speed, because dynamic pressure is ½ρv². An 87 km/h gust pushes about (87 ÷ 40)² ≈ 4.7 times harder than a 40 km/h one, which is why the jump between IMD's thunderstorm categories matters so much. Radar helps spot them early: see how Doppler weather radar sees storms.
If ideas like pressure, flow and v² are easier to see than to read, the Fermi Simulation Lab has interactive simulations you can try. The next time an alert pops up, check the colour first, then the number behind it.