On this page
When the India Meteorological Department (IMD) warns of heavy rain in your district, no one has looked at the clouds and guessed. A forecast is physics: measure what the air is doing now, then solve the equations that say what it must do next.
How does weather forecasting work in India?
An introductory lecture by Tom Hamill of the NOAA-CIRES Climate Diagnostics Center, hosted by ECMWF, breaks numerical weather prediction into five steps:
Gather observations of the air.
Data assimilation: blend those observations with the last forecast to get the best picture of the atmosphere right now.
Run the numerical model forward in time.
Post-process the model output.
Issue the forecast, then check it against what really happened.
In India, step 3 for the Bharat Forecast System runs on two government supercomputers, Arka at IITM Pune and Arunika at NCMRWF Noida, according to a written reply to Parliament published by PIB in August 2025.
What does IMD measure, and with what?
These figures compare IMD's network at the end of 2014 and 2025, from a Rajya Sabha reply published by PIB in January 2026.
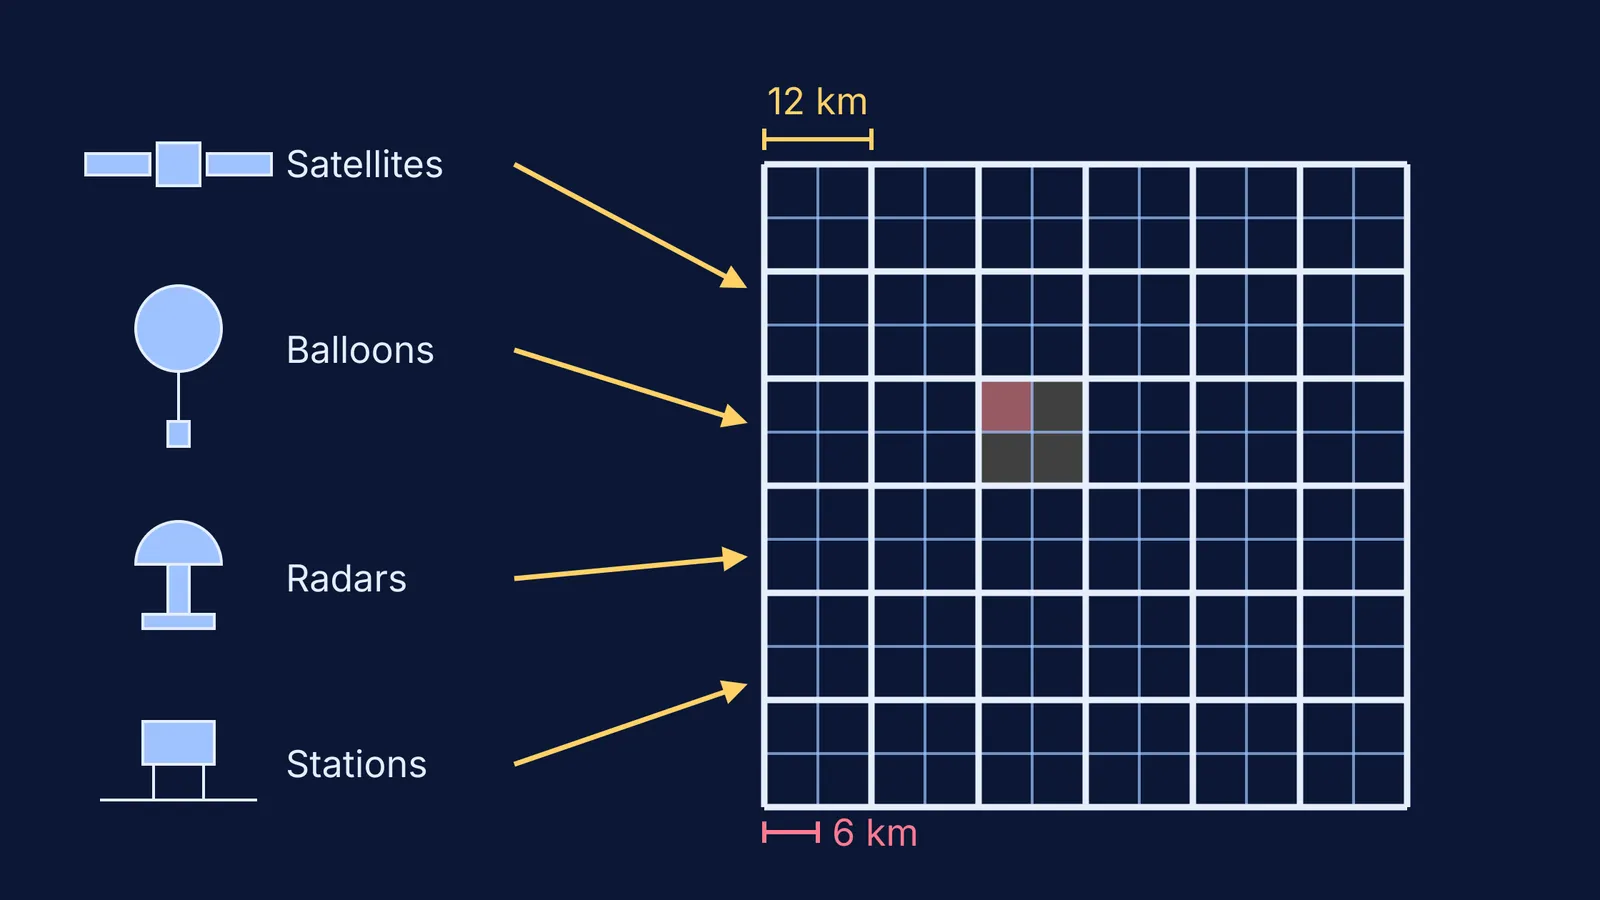
Ground stations: 1,008 automatic weather stations, up from 675, and 6,726 rain gauge stations. They record conditions such as pressure, temperature, humidity, wind and rain at the surface.
Weather balloons: 56 radiosonde/radiowind stations and 62 pilot balloon stations. A GPS radiosonde of the kind the US National Weather Service launches sends back pressure, temperature, relative humidity and GPS position every second and can climb above 35 km.
Radars: 47 Doppler weather radars, up from 15, with 87% of India's area under radar coverage. Our explainer shows how Doppler weather radar sees storms.
Satellites: INSAT-3DS, launched on 17 February 2024, carries a 6-channel imager and a 19-channel sounder and works alongside INSAT-3D and INSAT-3DR, according to ISRO's mission page.
What equations does a weather model solve?
Numerical weather prediction divides the atmosphere into millions of grid boxes and uses the laws of physics to work out how conditions in those boxes change over time, as ECMWF explains.
The Hamill lecture lists the equations ECMWF's model solves. Each one rests on an idea from school physics:
East-west wind and north-south wind: Newton's second law for a parcel of air. Pressure differences push air from high to low pressure, and the Earth's rotation turns it.
Temperature: energy conservation, the first law of thermodynamics. Air that rises expands and cools; sunlight and condensing water heat it.
Humidity: bookkeeping for water vapour, carried by the wind and lost when it condenses into cloud. See what relative humidity really means.
Continuity of mass and surface pressure: air is not created or destroyed, so air flowing into a column changes the pressure at its base.
The gas law ties pressure, temperature and density together inside these equations. ECMWF's main equations also assume hydrostatic equilibrium, where the fall of pressure with height is balanced by gravity, according to an ECMWF note from 2023. Processes smaller than a box, such as a single cloud, are approximated ("parameterized") rather than calculated directly, the Hamill lecture explains. For the history, read our profile of Jule Charney and the first weather computer.
Pressure gradients and parcels of rising air are easier to see than to read. The Fermi Simulation Lab has interactive simulations for ideas like these.
Why does a 6 km grid matter?
The Bharat Forecast System (BharatFS) runs at 6 km horizontal resolution, compared with about 12 km for the model before it and 9 to 14 km for typical global models, says the August 2025 PIB reply. The same reply says that in research mode it gave 30% better accuracy for extreme rainfall forecasts than the previous operational model.
To see what halving the grid spacing means, take a square of land 72 km on each side.
With 12 km boxes: 72 ÷ 12 = 6 boxes along each side, so 6 × 6 = 36 columns of air.
With 6 km boxes: 72 ÷ 6 = 12 along each side, so 12 × 12 = 144 columns.
Halving the spacing gives four times as many columns to calculate. That is why finer grids need far more computing power.
How can you use this in physics class?
At constant pressure, density is inversely proportional to absolute temperature. Air at 30 °C (303 K) that warms to 40 °C (313 K) at the same pressure has density 303 ÷ 313 ≈ 0.97 of what it was, so it is about 3% lighter than the air around it. That lighter air rises, expands and cools, which can be the start of a rain cloud.
If the gas law or thermodynamics still feels shaky, the Fermi Concept Library has a lesson for every concept in physics, each with its place in the map.