On this page
If you invest ₹100 and it grows by 10% in the first year, then 30% in the second year, what was your average yearly growth (Wikipedia)?
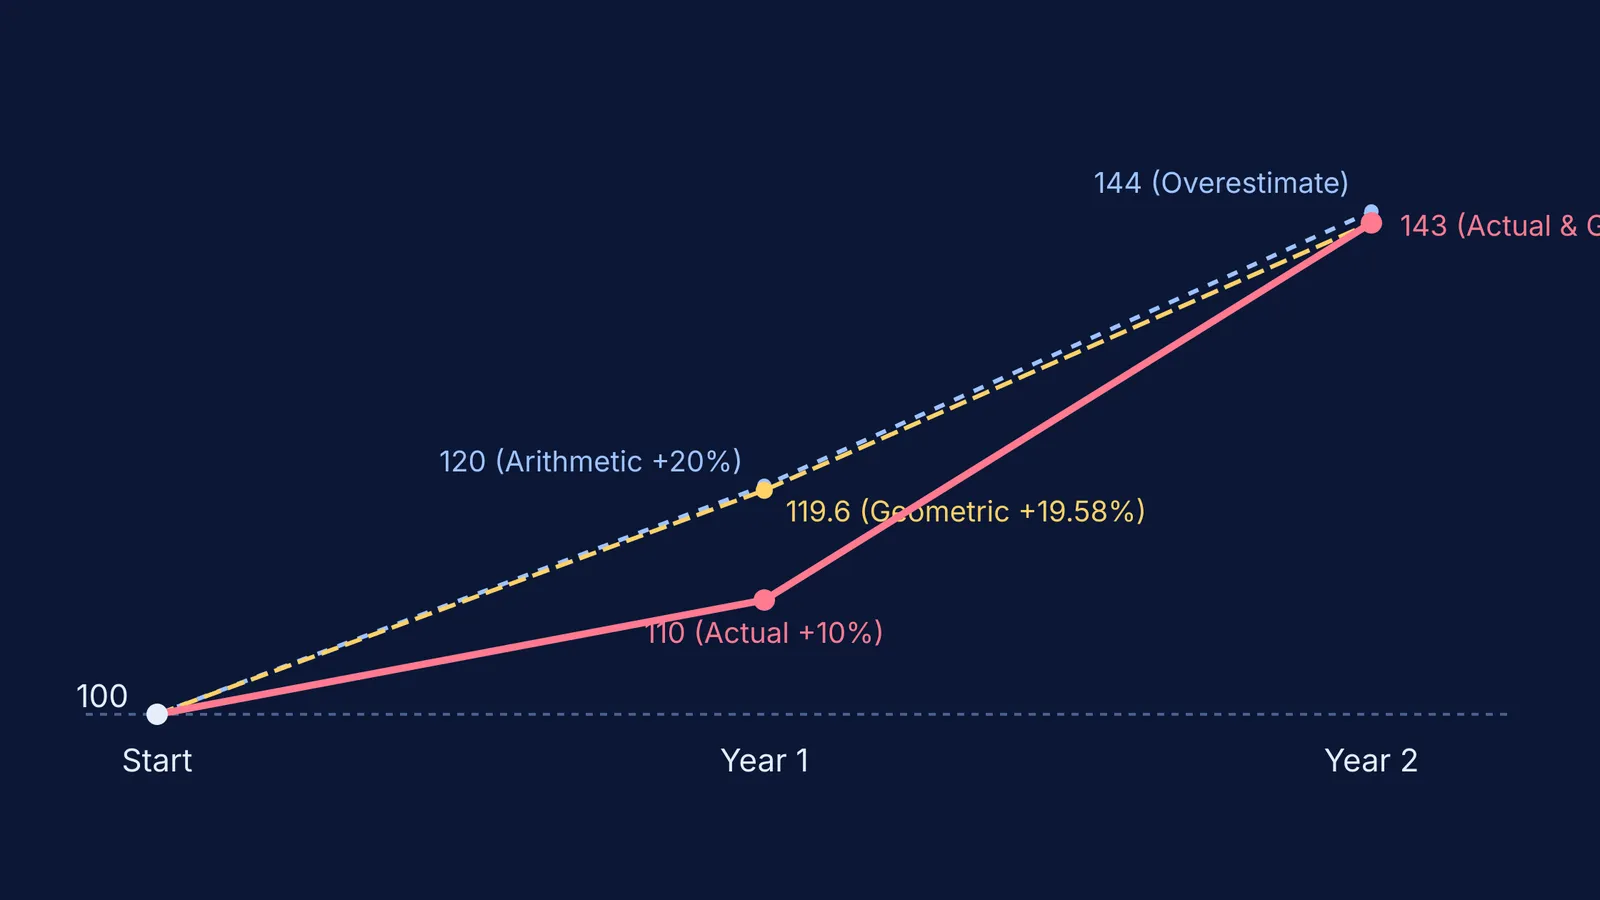
Most people instinctively add 10 and 30 to get 40, then divide by two. This gives an arithmetic mean of 20%. But if you assume your money grew by 20% each year, your final total would be wrong.
When things compound—like population growth, compound interest, or inflation—they multiply rather than add. To find the true average in a multiplicative process, you need the geometric mean, which comes out to 19.58% (Wikipedia).
Here is why the simple average fails, and how to find the exact growth rate instead.
Why does the arithmetic mean fail for growth?
To see why 20% is incorrect, run the numbers year by year using the compound growth formula (Wikipedia).
Start with 100.
A 10% increase gives you 110.
A 30% increase on that 110 adds another 33, bringing your total to 143.
Now, test the arithmetic mean of 20%.
A 20% increase on 100 gives you 120.
A 20% increase on that 120 adds another 24, giving you a total of 144.
The arithmetic average overestimates your growth. The gap gets worse if the numbers fluctuate more wildly. If an investment drops by 50% one year and rises by 50% the next, the arithmetic average is 0% (suggesting you broke even). In reality, half of 100 is 50, and a 50% gain on that leaves you with just 75. You have lost 25% of your money, yet the arithmetic average hides this completely.
How do you calculate the geometric mean?
The geometric mean of a set of values is the nth root of their product (Wikipedia).
To find the average growth rate for 10% and 30%, you follow three steps.
Convert the percentages to growth factors. A 10% increase means you have 110% of what you started with, or a multiplier of 1.10. A 30% increase becomes a multiplier of 1.30.
Multiply the factors. 1.10 × 1.30 = 1.43. (This means your total growth over two years is 43%).
Take the root. Since there are two years, take the square root of 1.43. √1.43 ≈ 1.1958.
Convert 1.1958 back to a percentage, and you get 19.58%. If your initial 100 grew by exactly 19.58% in year one, and again by 19.58% in year two, you would end up with exactly 143. This proves that 19.58% is the true average rate of growth over the two-year period.
How do you calculate growth over many years?
When you are tracking compounding growth across five or ten years, the arithmetic mean becomes increasingly inaccurate (Wikipedia). You can use this checklist to find the average on a standard scientific calculator.
Write down each year's growth factor (e.g. 5% growth is 1.05; a 12% loss is 0.88).
Multiply all the factors together.
Count how many years of growth you have. Let this number be n.
Use the y^x (or x^(1/y)) button on your calculator. Raise your total product to the power of (1/n).
Subtract 1 and multiply by 100 to get your final percentage.
For example, imagine a three-year period where a portfolio grows by 10%, then 20%, then drops by 10%. The factors are 1.10, 1.20, and 0.90. Their product is 1.188. Because there are three years, you take the cube root of 1.188, which is approximately 1.059. The true average growth is 5.9% per year. An arithmetic mean would give you 6.67%, falsely overstating your returns.
If you are dealing with large sets of compounding problems, you can use the Fermi Problem Library. It offers worked problems with a step-by-step solver that explains the reasoning rather than printing an answer, making it easier to track where an exponent or root might have gone wrong.
Why does this matter in exam problems?
Questions involving bacterial population growth in biology or half-life decay in physics rely on the same geometric principles (Wikipedia). Any time a value changes proportionally to its current size, rather than by a fixed amount, you must use multiplicative math.
In competitive entrance exams, multiple-choice options are often built around common conceptual errors. If an exam asks for the average rate of a population that grew 10% in the first hour and then 30% in the second hour, 20% will almost certainly be option A. The test setter knows that students working quickly under pressure will revert to the familiar arithmetic mean. By slowing down and converting your percentages to growth factors first, you bypass the trap completely.
The same rule applies when looking at long-term economic data or assessing stock portfolios in a commerce class. If a stock drops by 20% and then rises by 20%, you are not back to where you started. You have 80% of your original money, and a 20% gain on that only brings you to 96%. You have suffered a 4% overall loss. Remembering to calculate the geometric mean ensures you see the mathematical reality instead of a comforting illusion.
For more on mathematical ratios and averages, read our guides on How to Find the Missing Number When the Mean is Given and How to find the ratio of 50 paise to 2 rupees.