On this page
Every heartbeat starts as an electrical signal, and an ECG (electrocardiogram) draws that signal as a line. The NCERT Class 11 biology chapter Body Fluids and Circulation defines the ECG as “a graphical representation of the electrical activity of the heart during a cardiac cycle” (NCERT Biology, Chapter 15). Once you know which bump belongs to which chamber, heart-rate questions become a matter of counting.
What do the P wave, QRS complex and T wave represent?
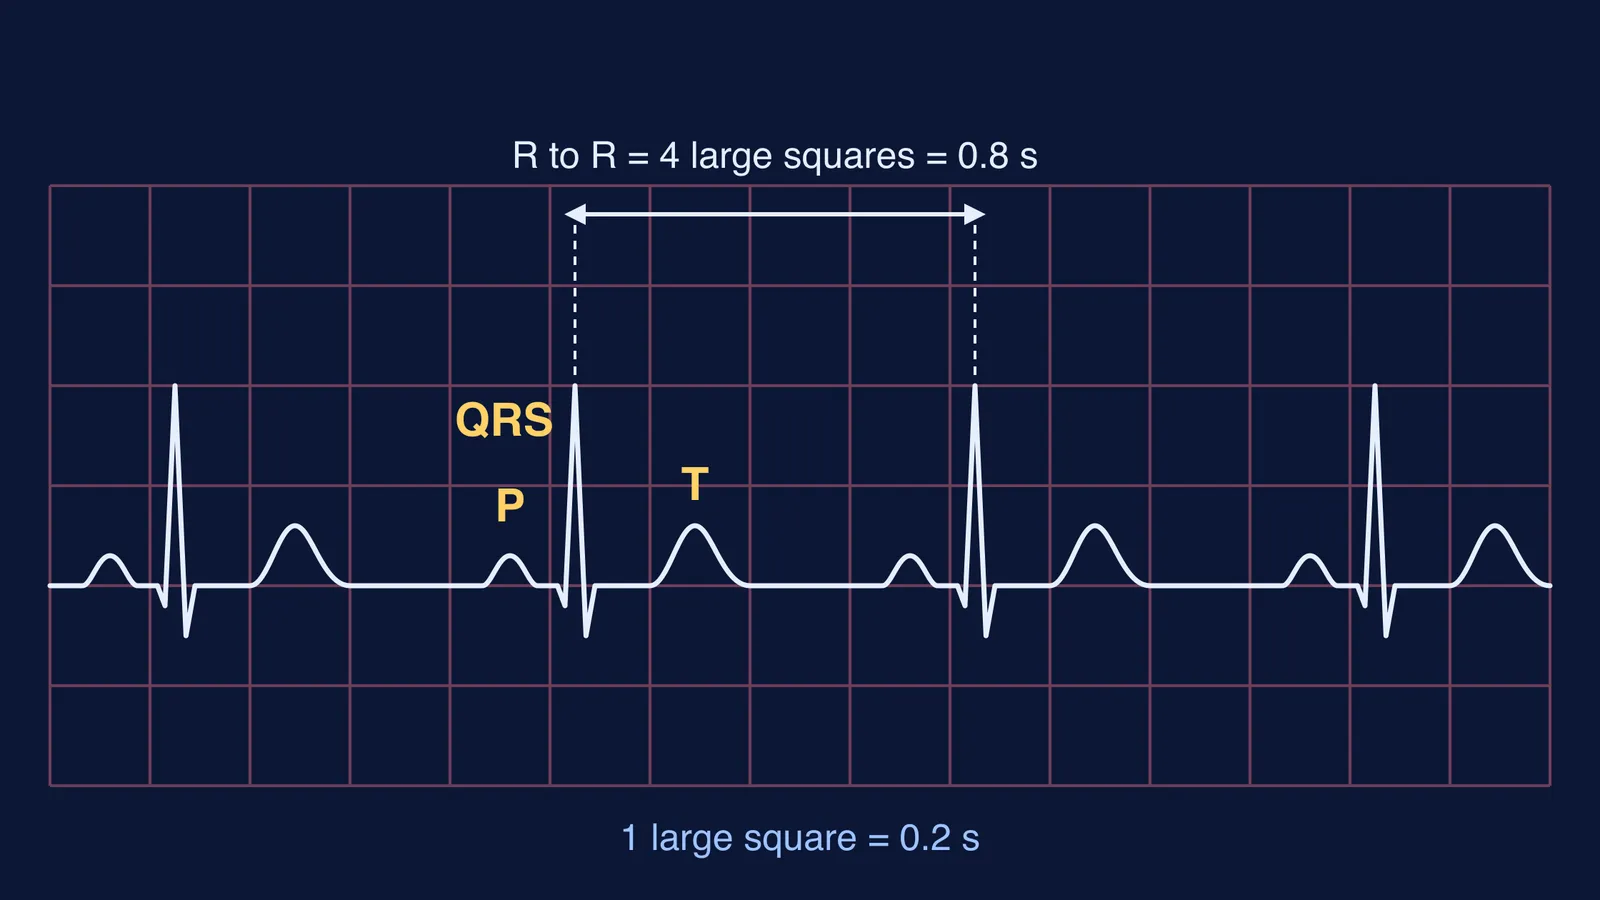
NCERT labels each peak with a letter from P to T, and each letter matches a specific electrical event in the heart (NCERT, section 15.3.3):
P wave: atrial depolarisation. The electrical excitation of the atria, which leads to both atria contracting.
QRS complex: ventricular depolarisation. It starts the ventricular contraction; NCERT notes that contraction begins shortly after Q and marks the beginning of systole.
T wave: ventricular repolarisation. The ventricles return from the excited state to the normal state, and the end of the T wave marks the end of systole.
Depolarisation is the electrical go signal that spreads through heart muscle before it contracts; repolarisation is the reset that follows. The order follows NCERT's conduction route: sino-atrial node, atria, atrio-ventricular node, bundle of His, ventricles.
Why is there no wave for atrial repolarisation?
The atria do reset, but you rarely see it on a normal trace. A 2018 paper in BioMedical Engineering OnLine states that atrial repolarisation waves, called Ta waves, “are usually unseen except during conduction system malfunction”, such as atrioventricular block (Tang, Ho and Chen, 2018). The authors note that ventricular activity is considerably stronger than atrial activity, so the small atrial reset signal stays hidden on a normal trace.
How do you read time on ECG paper?
A standard ECG is printed at 25 mm per second, so one small square (1 mm) is 0.04 s and one large square (5 small squares) is 0.2 s (LITFL, ECG rate interpretation). Five large squares make one second.
The PR interval, from the start of the P wave to the start of the QRS complex, is normally 120 to 200 ms, or three to five small squares, and reflects conduction through the AV node (LITFL, PR interval). A normal QRS complex is 70 to 100 ms wide (LITFL, QRS interval).
How do you calculate heart rate from an ECG?
NCERT puts the idea simply: count the QRS complexes in a given time and you have the heart rate (NCERT, section 15.3.3). Three practical versions, all described by LITFL:
300 rule, for a regular rhythm: divide 300 by the number of large squares between two R waves.
1500 rule, more precise: divide 1500 by the number of small squares between two R waves.
Count method, for an irregular or slow rhythm: count the R waves on a 10-second rhythm strip and multiply by 6.
Worked example. Look at the diagram at the top of this post. Two neighbouring R waves are 4 large squares apart.
Time per beat: 4 × 0.2 s = 0.8 s.
300 rule: 300 ÷ 4 = 75 beats per minute.
Check with small squares: 4 large squares are 20 small squares, and 1500 ÷ 20 = 75.
Check from first principles: 60 s ÷ 0.8 s = 75 beats per minute.
Why does 300 work? A minute holds 60 ÷ 0.2 = 300 large squares, so you are asking how many beat-lengths fit into a minute. The same logic gives 60 ÷ 0.04 = 1500 small squares per minute. If you forget a rule in the exam hall, rebuild it from the paper speed.
For comparison, NCERT gives a normal heart rate of 70 to 75 beats a minute, with an average of 72, and a cardiac cycle of about 0.8 s (NCERT, section 15.3).
What mistakes cost marks in ECG questions?
T wave is not atrial. It is ventricular repolarisation. Atrial repolarisation has no visible wave of its own.
QRS is the signal, not the squeeze. It is ventricular depolarisation, which starts the contraction; the muscle contracts shortly after.
Match the number to the square. Use 300 with large squares and 1500 with small squares (LITFL). One large square holds five small ones, so mixing them gives a rate five times too high or too low.
Count QRS complexes, not P waves, when NCERT asks for heart rate.
If depolarisation and repolarisation still feel like words rather than events, the Fermi Concept Library gives every biology concept its own lesson and its place in the map, so you can trace the ECG back to the cardiac cycle. If you are not sure where to start revising circulation, Fermi's AI tutor works out what you already know and builds a plan for the session.
Your next step: sketch one P-QRS-T beat from memory, label each part with its chamber and event, then time it on squared paper.