On this page
Chapter 1 of the NCERT Class 10 economics book, Understanding Economic Development, asks a question with no single answer: what counts as progress? The NCERT chapter on Development answers in three steps: people want different things, average income is the usual yardstick, and that yardstick misses a lot. Here is each idea with the textbook's own numbers, plus a frame for answers.
What does development mean in Class 10 economics?
In the chapter's opening table, landless rural labourers want more days of work, better wages and a local school that provides quality education, while prosperous farmers from Punjab want an assured high family income through higher support prices for their crops.
Two conclusions follow, and you should be able to state each in one line:
Different persons can have different developmental goals.
What may be development for one may not be development for another, and may even be destructive for them.
The textbook's example is a dam: industrialists may want more dams to get more electricity, while the people they would displace might prefer small check dams or tanks. People also want equal treatment, freedom, security and respect, which income alone does not capture.
What is per capita income and how is it calculated?
Per capita income is a country's total income divided by its total population. NCERT calls it average income and explains why we use it: countries have different populations, so total income alone does not tell you what an average person is likely to earn. The World Bank uses it to group countries, and the textbook places India among lower middle income countries.
Here is the textbook's own puzzle, worked out. Two countries each have five citizens, with these monthly incomes in rupees (NCERT Table 1.2):
Country A: 9,500, 10,500, 9,800, 10,000 and 10,200. The total is 50,000, so the average is 10,000.
Country B: 500, 500, 500, 500 and 48,000. The total is also 50,000, so the average is also 10,000.
Same average, very different lives: in Country B, four of five people earn ₹500 a month.
Why is per capita income not a complete measure of development?
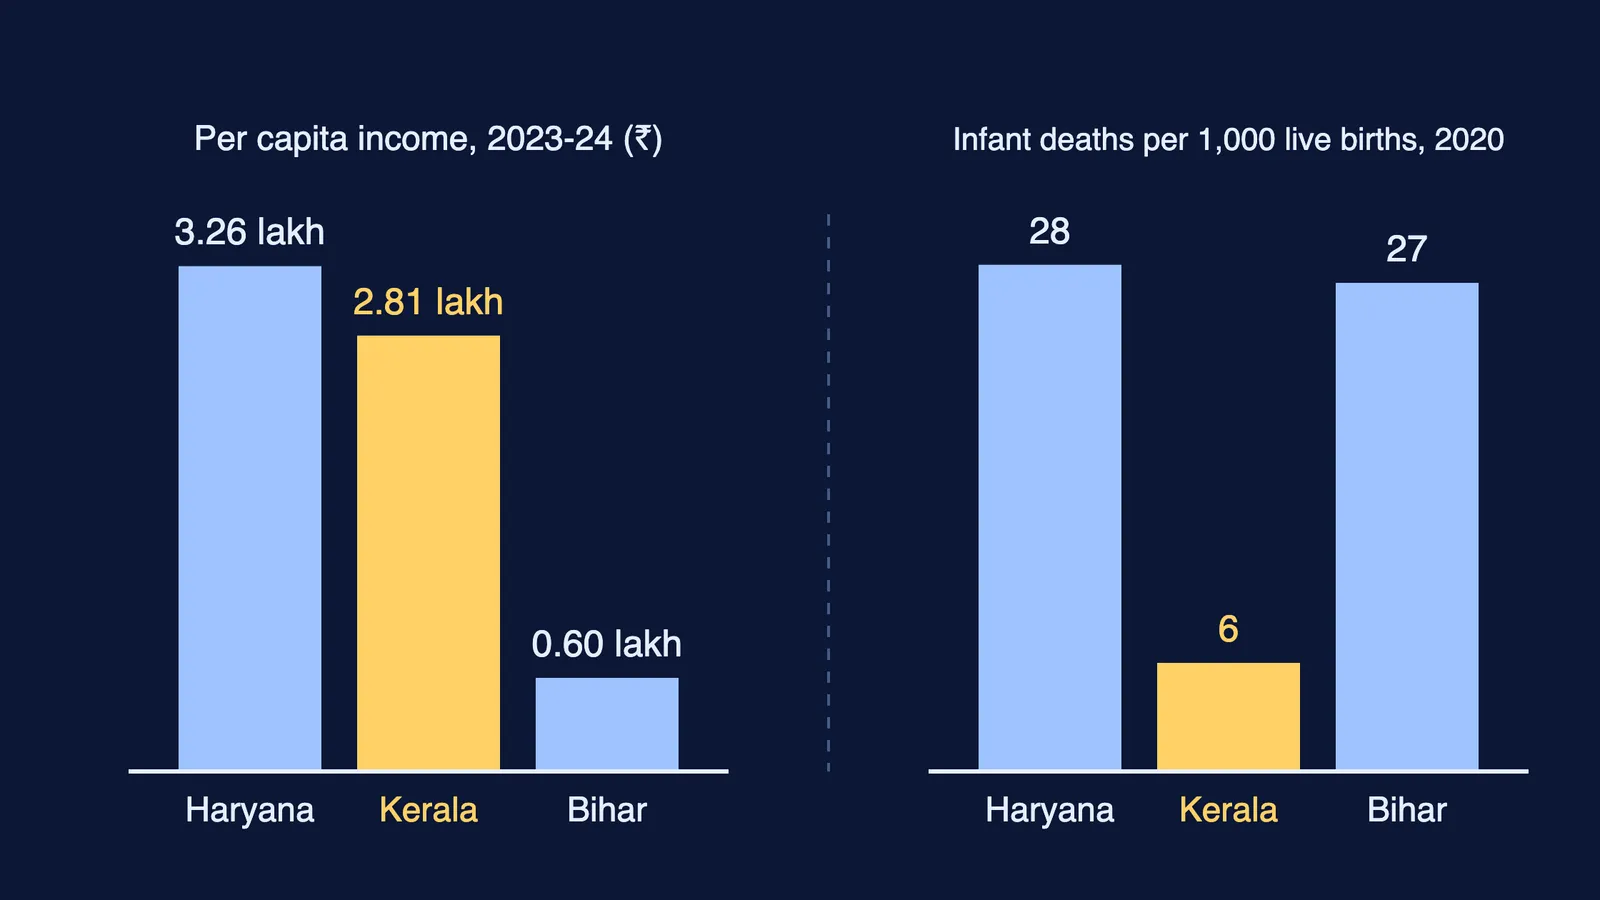
NCERT compares three states. Per capita income in 2023-24 was ₹3,25,759 in Haryana, ₹2,81,001 in Kerala and ₹60,337 in Bihar, drawn from the Economic Survey 2024-25 (NCERT Table 1.3). By income alone, Haryana looks the most developed.
In 2020, Kerala's infant mortality rate was 6 per 1,000 live births, against 28 in Haryana and 27 in Bihar, and in 2017-18 Kerala's literacy rate was 94% against 82% in Haryana and 62% in Bihar (NCERT Table 1.4). Haryana earns more per person, yet a baby born there was more than four times as likely as one in Kerala to die before their first birthday.
Learn the textbook's key line word for word: "money in your pocket cannot buy all the goods and services that you may need to live well." A pollution-free environment, unadulterated medicines and protection from infectious disease depend on what a community or government provides, and NCERT links Kerala's low infant mortality to adequate basic health and educational facilities. Our revision guide to Resources and development for Class 10 covers the geography side, including sustainable development.
What is the Human Development Index?
The Human Development Index (HDI) is the UNDP's summary measure of average achievement in three dimensions: a long and healthy life, being knowledgeable, and a decent standard of living (UNDP, Human Development Index). It is the geometric mean of three normalised indices, one for each dimension; our explainer on how HDI is calculated from three indices shows the arithmetic.
India's HDI was 0.685 in 2023, ranking 130, in the UNDP's medium human development group (UNDP Human Development Report 2025 data). In the same data, India's life expectancy at birth was 72.0 years, adults averaged 6.88 years of schooling, and gross national income per head was about $9,047 in 2021 PPP dollars. NCERT Table 1.6 uses these figures, rounded, and notes that the ranks are out of 193 countries.
The same UNDP data puts India's loss from inequality at 30.7% in 2023: once gaps between people in health, education and income are counted, the index falls by nearly a third. It is the lesson of Country A and Country B, at national scale.
How should you write an answer on this chapter?
Use this four-part frame for "Why is per capita income not an adequate indicator of development?":
Define it: per capita income is total income divided by total population.
Say what it does well: it lets you compare countries of very different sizes.
Give two limits: it hides how income is distributed (Country A and B), and it leaves out goals such as health, education, safety and freedom.
Prove it with data: Haryana's per capita income is higher than Kerala's, but Kerala's infant mortality rate is 6 against Haryana's 28 (NCERT Tables 1.3 and 1.4).
For revision, put the three-state numbers and India's HDI on one card and practise explaining, without notes, why a richer state can have worse health. If averages and geometric means still feel shaky, the Fermi Concept Library covers every concept in mathematics, each with its own lesson.
Curious about measuring well-being for a living? Read how to become an economist in India.