On this page
Chennai already drinks the sea. The city's water board runs three desalination plants, at Minjur (100 MLD), Nemmeli (110 MLD) and Nemmeli (150 MLD), with a combined capacity of 360 million litres a day, DT Next reported in September 2026. Two more 400 MLD plants, one under construction at Perur (expected in October 2027) and one announced for Minjur, would take the city to 1,160 MLD, the same report says. So how does a membrane make the Bay of Bengal drinkable, and why does it take so much power?
How is seawater made drinkable?
Osmosis is water moving through a membrane from the dilute side to the salty side; you see it when salt pulls water out of a salad. The pressure that would just stop that flow is the osmotic pressure. Reverse osmosis pushes on the salty side harder than the osmotic pressure, so water flows the other way, out of the seawater, and the dissolved salts stay behind.
A plant works in five stages, as the US Department of Energy's 2017 desalination study describes them:
Intake: seawater is pumped in from the sea.
Pre-treatment: flocculation, coagulation, sand filtration and cartridge filtration remove particles that would clog the membranes.
Reverse osmosis: high-pressure pumps force water through the membranes. The study's reference case turns 35,000 ppm seawater into 500 ppm product water at 50% recovery.
Post-treatment: remineralisation and disinfection make the water fit to drink.
Concentrate management: the leftover brine goes back to the sea.
Recovery is the share of the seawater that comes out as fresh water. Industrial reverse osmosis runs at 60-80 bar with 40-50% recovery, according to a DWSIM process-simulation tutorial.
What is the osmotic pressure of seawater?
You can estimate it with the van 't Hoff equation from Class 12 chemistry, π = iCRT.
Worked example. Seawater carries about 35 g of salt per kg (DWSIM tutorial). Treat it all as NaCl (58.5 g/mol): that is roughly 0.6 mol per litre. Each NaCl gives two ions, so i = 2 and iC = 1.2 mol/L. With R = 0.0831 L bar mol⁻¹ K⁻¹ and T = 298 K, π = 1.2 × 0.0831 × 298 ≈ 30 bar.
The real figure is a little lower because ions in a crowded solution do not act fully independently. Seawater's osmotic pressure is around 25-28 bar, according to the same tutorial. That is roughly the water pressure 270 metres under the sea.
Why does desalination use so much energy?
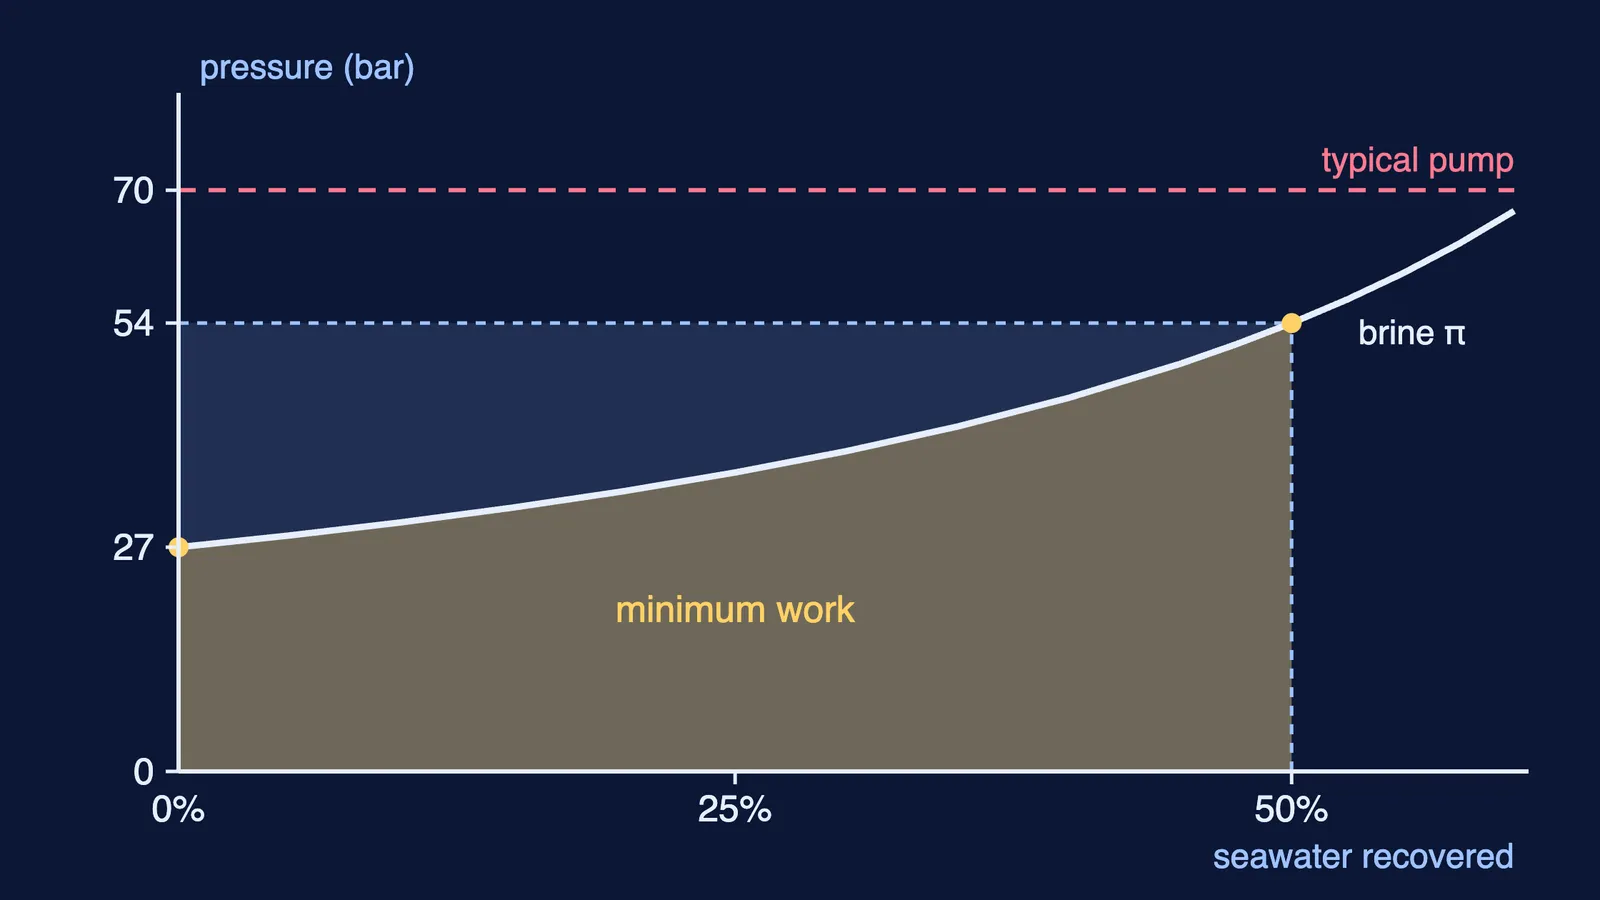
Pressure times volume is energy. Pushing 1 cubic metre of water against seawater's osmotic pressure of about 27 bar (DWSIM tutorial), or 2.7 × 10⁶ Pa, takes 2.7 × 10⁶ J, which is 0.75 kWh.
But the brine gets saltier as you go. At 50% recovery the same salt sits in half the water, so its osmotic pressure doubles to about 54 bar. For an ideal solution the average pressure over the whole run is 27 × 2 ln 2 ≈ 37 bar, which works out to about 1.04 kWh per cubic metre of fresh water.
That matches the official number: the thermodynamic minimum is 1.06 kWh per cubic metre for 35,000 ppm seawater at 50% recovery, according to the US Department of Energy study. No process can go below it.
Real plants use about three times as much. A simple one-stage plant must hold its pump above the final 54 bar for the whole run, which already means at least 1.5 kWh per cubic metre. Friction and pump losses add more. The DOE study used 2.7 kWh per cubic metre for the reverse osmosis step at the Carlsbad plant in California, 4.0 kWh for the remaining, older plants, and a weighted US typical value of 3.3 kWh, with energy recovery included. A 2011 review in Science by Menachem Elimelech and William Phillip notes that, despite major advances, seawater desalination is still more energy intensive than treating fresh water.
How much power do Chennai's plants need?
We found no published energy figure for Chennai's plants, so here is an estimate you can check, from the 360 MLD capacity in DT Next and the US energy figures from the DOE study:
At the thermodynamic floor: 360,000 cubic metres × 1.06 kWh ≈ 3.8 lakh kWh a day.
At the DOE's typical 3.3 kWh: 360,000 × 3.3 ≈ 11.9 lakh kWh, about 1.2 GWh, a day for the reverse osmosis step alone.
Today's figure is lower: DT Next reports the Minjur plant is being renovated.
How can you estimate any plant's energy use?
Convert the salinity into moles of ions per litre.
Find π with iCRT, then knock off about a tenth for real ions.
Pick the recovery r; the final brine osmotic pressure is π ÷ (1 − r).
The ideal average pressure is π × ln(1/(1 − r)) ÷ r; divide it by 36 for the minimum kWh per cubic metre.
Multiply by about three for a real plant, as the DOE figures suggest, then by the daily output.
If the jump from π = iCRT to an electricity bill does not click, the Fermi Problem Library has worked problems with a step-by-step solver that explains the reasoning rather than printing an answer, and the Fermi Simulation Lab has interactive simulations for ideas that are easier to see than to read.
Marine fish fight the same osmotic pressure every day; see how freshwater and marine fish handle osmosis.