
On this page
Einstein's photoelectric equation is one line of energy bookkeeping. A photon's energy hν pays the work function φ to free an electron, and what is left over is the kinetic energy of the fastest electron. See it that way and the stopping-potential graph falls out of the algebra.
What does Einstein's photoelectric equation say?
In a 1905 paper in Annalen der Physik, Einstein proposed that light delivers energy in separate quanta (Einstein 1905, Annalen der Physik). Today we call one quantum a photon and write its energy as E = hν.
The photoelectric equation is K max = hν − φ, where φ, the work function, is the energy needed to free an electron from the surface of a particular metal (OpenStax University Physics, Volume 3).
How do you derive hν = φ + K max step by step?
One photon, one electron. An electron absorbs a whole photon, with energy hν, or none of it.
Pay to leave. Escaping the metal costs at least φ; electrons from deeper inside lose extra on the way out.
Conserve energy. For the electron that pays only φ, hν = φ + K max. Every other electron leaves with less, so the equation gives the maximum kinetic energy.
Find the threshold. K max cannot be negative, so emission needs hν ≥ φ, giving the threshold frequency ν₀ = φ/h. Below ν₀ no electrons come out, however bright the light.
Separate intensity from frequency. Brighter light means more photons per second, so more electrons and more current. Each photon still carries only hν, so K max does not change.
The wave picture could not explain step 5, and our post on why wave theory cannot explain the photoelectric effect walks through it.
How does the stopping potential vs frequency graph follow from the equation?
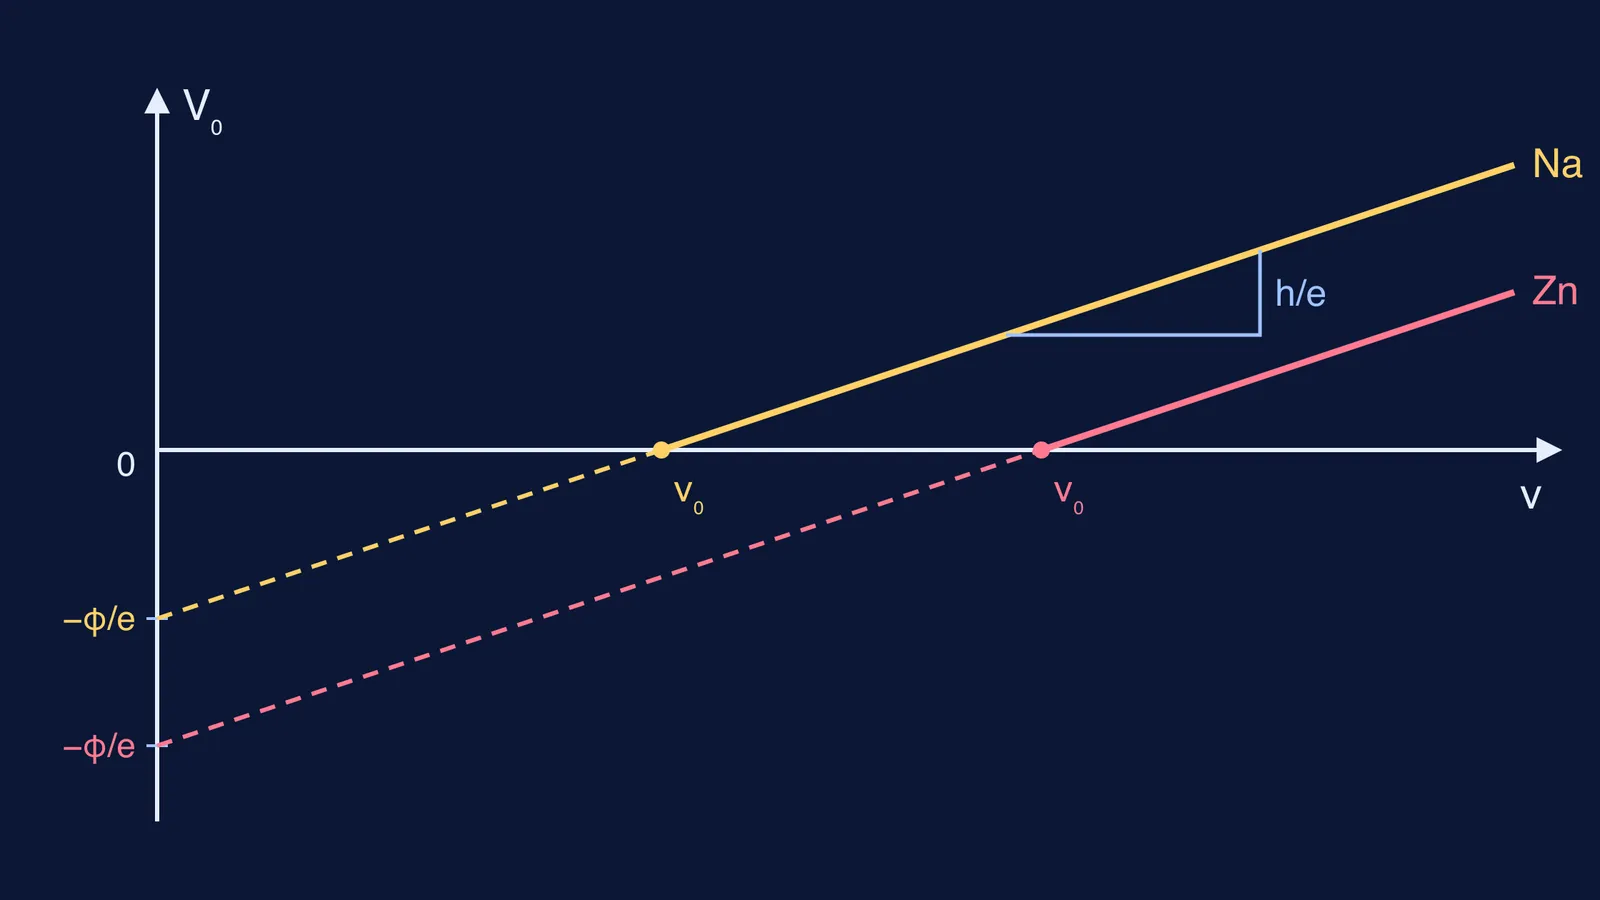
You measure K max by making the collector negative and raising this reverse voltage until even the fastest electrons turn back. That voltage is the stopping potential V₀, and K max = eV₀ (OpenStax University Physics, Volume 3).
Substitute into the energy balance, eV₀ = hν − φ, and divide by e:
V₀ = (h/e)ν − φ/e
This has the form y = mx + c, so the graph reads straight off it:
Slope = h/e, the same for every metal. With the exact values h = 6.62607015 × 10⁻³⁴ J s (NIST CODATA value of h) and e = 1.602176634 × 10⁻¹⁹ C (NIST CODATA value of e), h/e ≈ 4.14 × 10⁻¹⁵ V s.
Frequency-axis intercept = ν₀ = φ/h, which is different for each metal.
Extrapolated V₀-axis intercept = −φ/e. In volts, it equals the work function in eV, with a minus sign.
Below ν₀ nothing is measured. The dashed part of the line is an extrapolation, not data.
So different metals give parallel lines, and a metal with a larger φ sits further to the right. Millikan measured this line to find h in a 1916 paper titled "A Direct Photoelectric Determination of Planck's h" (Millikan 1916, Physical Review). The story is in how Millikan tested Einstein's photoelectric equation, and the reasoning behind the slope is in why the slope of the stopping potential vs frequency graph is h/e.
Other graphs follow the same way. Don't mix up their slopes:K max (in J) against ν has slope h and intercept −φ; V₀ against 1/λ has slope hc/e.
Worked example: what is the stopping potential for sodium?
The OpenStax table lists sodium's work function as φ = 2.46 eV (OpenStax University Physics, Volume 3). Shine light of frequency ν = 1.00 × 10¹⁵ Hz on it.
Photon energy: hν = 6.626 × 10⁻³⁴ × 1.00 × 10¹⁵ = 6.63 × 10⁻¹⁹ J, or 4.14 eV after dividing by e.
Maximum kinetic energy: K max = 4.14 − 2.46 = 1.68 eV.
Stopping potential: V₀ = 1.68 V.
Threshold: ν₀ = φ/h = (2.46 × 1.602 × 10⁻¹⁹ J) ÷ (6.626 × 10⁻³⁴ J s) ≈ 5.95 × 10¹⁴ Hz.
Graph check: slope × (ν − ν₀) = 4.14 × 10⁻¹⁵ × 4.05 × 10¹⁴ ≈ 1.68 V. Both routes agree.
Zinc, listed at 4.31 eV in the same table, gives 4.14 − 4.31, which is negative, so no electrons are emitted. Its threshold is about 1.04 × 10¹⁵ Hz.
Which mistakes cost marks on photoelectric graphs?
Drawing the V₀ line through the origin. It crosses the frequency axis at ν₀, not at zero.
Giving different metals different slopes. The slope is always h/e, so the lines are parallel.
Letting intensity change V₀. Intensity changes the saturation current, not the stopping potential.
Subtracting a work function in eV from a photon energy in J. Convert first.
To practise, the Fermi Problem Library has worked problems with a step-by-step solver that explains the reasoning rather than printing an answer. If the idea of a work function itself feels shaky, the Fermi Concept Library gives each concept in physics its own lesson and its place in the map.
Tonight, redo the sodium example from memory using a new frequency, and check your answer both ways.