

On this page
When a beam of white sunlight strikes a glass prism, it does not merely bend: it unfurls into a vibrant ribbon of colour ranging from deep red to bright violet. This separation of light into its constituent wavelengths—known as optical dispersion—forms the foundation of spectroscopy, lens design, and rainbow formation. To understand why each colour follows its own unique trajectory, physicists turn to an empirical formula that links refractive index to wavelength.
What is Cauchy's relation between refractive index and wavelength?
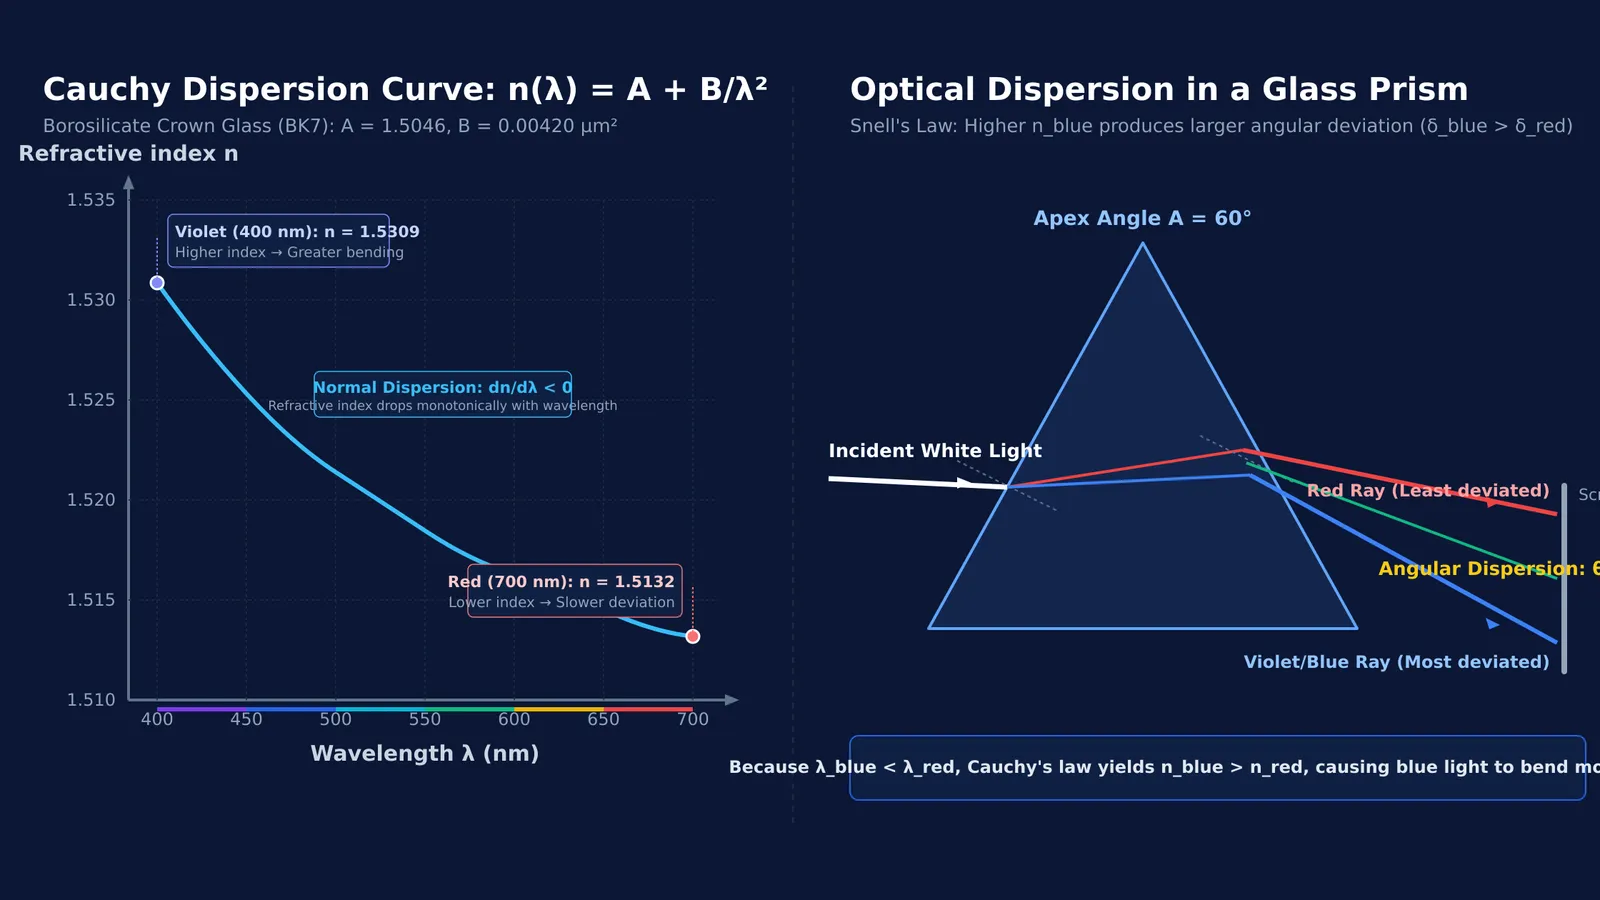
In the 1830s, French mathematician Augustin-Louis Cauchy investigated how light waves interact with matter, publishing his findings in Cauchy's equation. In transparent regions of the optical spectrum where glass absorbs negligible light, Cauchy demonstrated that the refractive index n varies inversely with the square of the wavelength λ:
n(λ) ≈ A + B / λ²
Here, λ denotes the vacuum wavelength in micrometres (μm), while A and B are positive empirical constants specific to each medium. The dimensionless constant A represents the baseline refractive index as wavelength approaches infinity, while B (in μm²) dictates how sharply the index changes with wavelength.
According to optical glass measurements recorded in the SPIE Optical Glass handbook, standard borosilicate crown glass (BK7) possesses Cauchy constants of approximately A = 1.5046 and B = 0.00420 μm². For fused silica, the corresponding parameters are A = 1.4580 and B = 0.00354 μm².
Because wavelength appears squared in the denominator, increasing wavelength causes B / λ² to decrease. Longer wavelengths therefore experience a smaller refractive index, while shorter wavelengths encounter a higher index. In optics, this negative rate of change, dn/dλ < 0, is known as normal dispersion.
For students exploring how geometric shapes govern ray paths, seeing why a prism disperses light while a rectangular glass slab does not clarifies how non-parallel boundaries prevent emerging rays from recombining into white light. When connecting wave theory to practical ray diagrams across your syllabus, the Fermi Concept Library organizes every concept in physics, chemistry, biology, mathematics and computing, each with its own lesson and its place in the map.
Why does blue light bend more than red light in a prism?
The fact that blue light bends more sharply than red light stems from a sequence of four interconnected physical laws taught in NCERT Class 12 Physics:
Wavelength difference: Red light has longer visible wavelengths near 700 nm (0.70 μm), while violet and blue light have shorter wavelengths near 400 nm to 450 nm (0.40 μm to 0.45 μm).
Refractive index difference: By Cauchy's formula, blue light's shorter wavelength produces a larger B / λ² term, so glass has a higher refractive index for blue than for red (n_blue > n_red).
Speed in the medium: Refractive index is defined as n = c / v. Because n_blue > n_red, blue light travels slower through glass than red light (v_blue < v_red).
Angle of deviation: For a thin prism of apex angle A, Snell's law gives deviation δ ≈ (n − 1) A. Because n_blue > n_red, blue light undergoes greater angular deviation: δ_blue > δ_red.
As the beam enters the front face and exits the rear face of a triangular prism, both refractions bend the rays toward the thicker base. Because blue light suffers a larger deviation at each surface, it emerges at a steeper angle than red light, fanning out the colours across an angular spread known as angular dispersion.
You can explore this geometry in detail by calculating a prism's angle of minimum deviation to see how symmetrical ray paths produce the sharpest spectral resolution.
How do you calculate dispersion using Cauchy's formula?
To see Cauchy's equation in practice, consider a worked numerical problem using borosilicate crown glass (BK7) with coefficients recorded in the SPIE Optical Glass handbook (A = 1.5046 and B = 0.00420 μm²) in a thin prism with an apex angle of 6.0° based on thin-prism formulas from NCERT Class 12 Physics:
Refractive index for red light (λ_red = 700 nm = 0.70 μm): n_red = 1.5046 + 0.00420 / (0.70)² ≈ 1.5046 + 0.00857 = 1.5132.
Refractive index for blue light (λ_blue = 400 nm = 0.40 μm): n_blue = 1.5046 + 0.00420 / (0.40)² ≈ 1.5046 + 0.02625 = 1.5309.
Index difference: Δn = n_blue − n_red = 1.5309 − 1.5132 = 0.0177.
Angular deviation for each colour (δ ≈ (n − 1) A): δ_red = 0.5132 × 6.0° = 3.079°, and δ_blue = 0.5309 × 6.0° = 3.185°.
Angular dispersion: θ = δ_blue − δ_red = 3.185° − 3.079° = 0.106° (about 6.4 arcminutes).
This 0.106° angular split creates the visible spectrum on a screen behind the prism. In camera and telescope lenses, this same dispersion causes different colours to focus at different focal points along the optical axis. Optical designers eliminate this distortion with achromatic lens combinations that cancel chromatic aberration.
When practicing multi-step optics numericals that combine thin-prism geometry with dispersion indices, the Fermi Problem Library provides worked problems with a step-by-step solver that explains the reasoning rather than printing an answer.
What are the limits of Cauchy's equation across the spectrum?
While Cauchy's relation works remarkably well across visible wavelengths, it is an empirical approximation rather than a fundamental physical law, as explained in Eugene Hecht's classic treatise *Optics*.
Cauchy formulated his equation before physicists discovered electronic resonances inside atoms. In transparent dielectric media, bound electrons possess characteristic natural resonance frequencies in the ultraviolet region (wavelengths shorter than 200 nm). For visible light, the operating frequency sits safely below these UV resonances. As the light's frequency rises toward the ultraviolet—corresponding to shorter wavelengths—the oscillating electric field drives bound electrons closer to resonance, increasing atomic polarizability and slowing the wave down.
However, Cauchy's formula breaks down if you venture into the infrared spectrum or approach an absorption band. Near resonance, materials exhibit anomalous dispersion, where the refractive index drops sharply as wavelength decreases (dn/dλ > 0). For broadband optical engineering spanning the ultraviolet through the infrared, scientists replace Cauchy's relation with the Sellmeier equation or the Lorentz oscillator model.
For visual learners wanting to test wave propagation and watch how phase velocity shifts as wavelength varies, the Fermi Simulation Lab offers interactive simulations for the ideas that are easier to see than to read.


