

On this page
Every chemical reaction needs a minimum amount of energy to begin, known as the activation energy. Without this initial spark, even reactions that ultimately release energy would never start.
In our bodies, waiting for molecules to randomly collide with enough force is too slow to sustain life. Enzymes solve this problem. If you want to understand how they work, the clearest way is to look at a reaction coordinate diagram, also known as a free energy graph.
What does the activation energy graph show?
An activation energy graph tracks a reaction from start to finish.
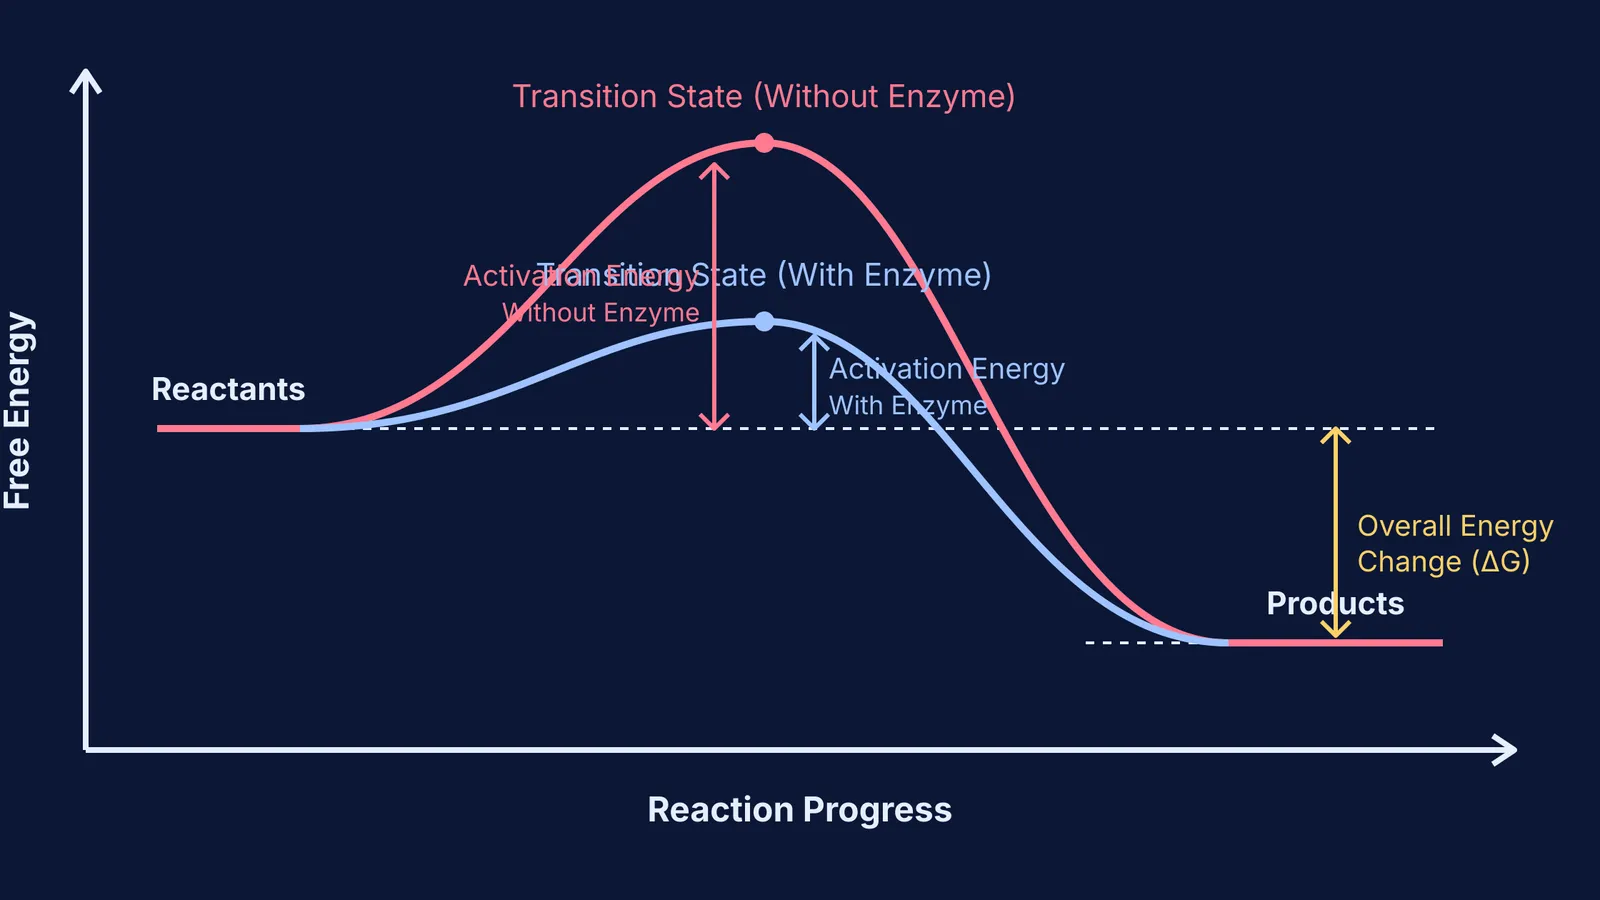
The y-axis (Free Energy): This shows the potential energy stored in the molecules.
The x-axis (Reaction Progress): This is the timeline, moving from reactants on the left to products on the right.
The reactants start at a specific energy level. To turn into products, they must first absorb enough energy to contort into a highly unstable, high-energy arrangement called the transition state. The energy required to reach this peak is the activation energy. Think of it as pushing a heavy boulder to the top of a hill before it can roll down the other side.
If you are trying to picture exactly how molecules align and collide in space, the Fermi Simulation Lab lets you run interactive experiments to see these forces in action.
Why does the enzyme path have a lower peak?
When you look at the graph of an enzyme-catalyzed reaction, you see two curves. The higher curve is the uncatalyzed reaction. The lower curve represents the reaction with an enzyme.
An enzyme acts like a construction crew digging a tunnel through the hill. It provides an alternative pathway with a much lower energy barrier. For example, hydrogen peroxide naturally breaks down into water and oxygen, but the uncatalyzed reaction has a high activation energy. When the enzyme catalase is present, it lowers this activation energy significantly.
How does the transition state change?
The peak of the graph represents the transition state. This is a fleeting, unstable moment where old bonds are breaking and new bonds are forming.
Without an enzyme, reaching this state requires a high-impact collision at the perfect angle. Most collisions fail because the molecules simply bounce off each other without reacting.
When a substrate enters an enzyme's active site, the enzyme subtly changes shape to grip it tightly, a process called induced fit. This physical embrace bends the substrate, weakening its bonds and bringing reacting groups close together. Because the enzyme stabilizes this awkward arrangement, the transition state becomes much easier to achieve. Consequently, the energy peak on your graph drops, and the reaction proceeds significantly faster.
In many biological processes, a single enzyme molecule can process numerous substrate molecules every second. This astonishing turnover rate is entirely due to the lowered activation energy. Once the products form, they no longer fit the active site perfectly. The enzyme releases them and instantly binds a new substrate, ready to repeat the cycle without being consumed or permanently changed by the reaction.
Does temperature change the activation energy?
A common mistake is thinking that adding heat lowers the activation energy. It does not. The activation energy barrier is a fixed property of the chemical reaction.
When you heat a solution, you are giving the reactant molecules more kinetic energy. They move faster and collide more violently. In a Maxwell-Boltzmann distribution graph, heating shifts the curve to the right, meaning a larger fraction of molecules now have enough energy to clear the existing barrier.
In contrast, an enzyme does not change the energy of the molecules. Instead, it lowers the barrier itself. This distinction is critical: temperature changes how many molecules can jump the hurdle, while an enzyme shrinks the hurdle so that even slow-moving molecules can step over it.
Why does the overall energy change stay the same?
Notice where the two curves start and end on the graph. Both the uncatalyzed and catalyzed paths begin at the exact same reactant energy level and finish at the exact same product energy level.
An enzyme does not change the laws of thermodynamics. It cannot alter the total energy of the reactants or the products, meaning the net energy change (ΔG) remains identical. An enzyme simply speeds up the journey to the end point; it does not change where the journey ends.
If you have gaps in your understanding of kinetics or thermodynamics, you can review the fundamental principles in the Fermi Concept Library.
How do you read an energy diagram?
If you are asked to interpret an activation energy graph in exams like NEET or JEE, use this routine to avoid common mistakes:
Identify the net change: The vertical gap from the reactant line to the product line is the overall energy change. If the products are lower, energy was released (an exothermic reaction).
Find the activation energy (Ea): Measure the vertical distance from the reactant starting line straight up to the peak.
Compare the peaks: The curve with the lower peak is always the enzyme-catalyzed pathway.
Remember what stays constant: The starting point, the ending point, and the net energy change never move, regardless of whether a catalyst is added.
For more practice with these concepts, you can explore How to Find Activation Energy From an Arrhenius Plot or read about The difference between rate of reaction and rate constant. If you are looking ahead in biology, you might also want to understand Competitive vs Noncompetitive Inhibition: Will More Substrate Help?.


