On this page
A graph question in a biology paper is a short reading test. Many marks slip away before any biology starts: you jump to the options and pick the one that sounds familiar. The fix is a habit: read the graph, put it into words, link it to the concept, and only then answer.
Why do students lose marks on biology graph questions?
Often the problem is where you look first, not how much you know. In a 2019 eye-tracking study in CBE Life Sciences Education, Harsh and colleagues tracked the eyes of 36 people working through graph tasks, from non-science undergraduates to science faculty. The more experienced participants were, the more likely they were to look first at the graph's context and data. Less experienced participants leaned more on the question prompt and the answer options. Undergraduates described sensible plans in interviews, but what their eyes actually did often did not match those plans.
Board papers test this skill too. In the CBSE Class XII Biology curriculum for 2026-27, 20% of the theory paper is set for the competency "Analyse, Evaluate and Create". The same document lists "interpret" and "analyse" among the verbs for that competency. It also expects students to draw inferences from data.
How do you read a biology graph step by step?
Cover the options with your hand or a ruler, then work through four steps.
Axes. Name the variable on each axis and its unit. The x-axis is usually what was changed, the y-axis what was measured. Say it aloud: "This shows reaction velocity against substrate concentration."
Labels. Read the title, the key and any marked points (Vmax, an optimum, a threshold). Check whether the axis starts at zero and whether the scale is even.
Trend in words. Describe the shape in one sentence: rises, falls, peaks, levels off, S-shaped. Say where it changes.
Concept link. Ask which chapter idea produces that shape, and why.
Now uncover the options and look for the one that matches your sentence.
The official marking scheme uses the same shape of answer. For a question built on a data table in the CBSE Class XII Biology sample paper marking scheme for 2026-27, the model answer opens "As tumor size increases, glucose levels decrease" and only then gives the biological reason.
Worked example: how do you answer an enzyme graph question?
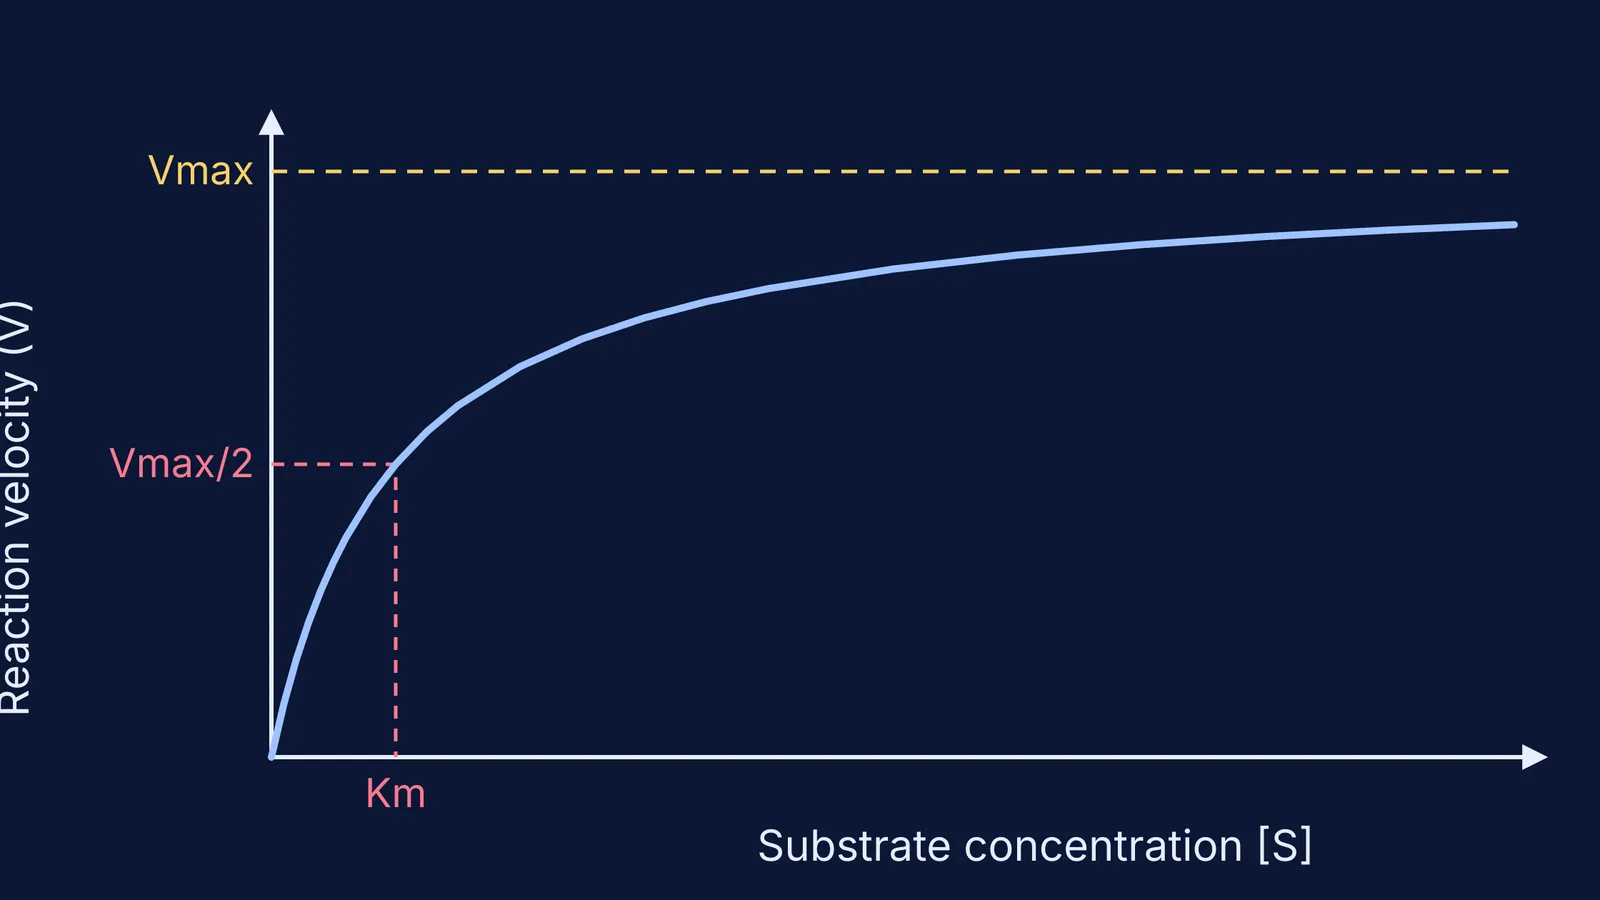
Take the substrate concentration graph from the NCERT Class 11 Biology chapter on biomolecules (Figure 9.5c), the curve in the image above. A typical question: "Why does adding more substrate beyond a certain point not increase the rate of reaction?"
Axes: velocity of reaction (V) on the y-axis, substrate concentration [S] on the x-axis.
Labels: Vmax is marked with a dashed line; Km is the substrate concentration at half of Vmax.
Trend in words: "As [S] increases, V rises steeply at first, then levels off and approaches Vmax."
Concept link: NCERT explains that the enzyme molecules are fewer than the substrate molecules. Once they are saturated, no free enzyme is left to bind extra substrate.
Answer: the active sites are all occupied, so the enzyme is already working at its maximum rate and extra substrate has to wait.
The common trap is reading the flat part as "the enzyme has stopped working". A plateau means the rate has stopped changing, not that the reaction has stopped. For more on this curve, see our explainer on why enzyme rate levels off with substrate.
Which graph shapes are common in biology?
Knowing the common shapes, and the idea each usually signals, makes step 4 faster.
Rise then plateau: saturation, as in the enzyme curve above.
Single peak: an optimum. NCERT's enzyme activity graphs for temperature and pH (Figure 9.5a and b) peak and then fall on both sides.
S-shaped: the oxygen dissociation curve of haemoglobin; see how the oxygen dissociation curve shifts.
Phases: a bacterial growth curve has lag, log, stationary and death phases; see the phases of a bacterial growth curve.
If step 4 keeps stalling because the idea behind a shape is unclear, the Fermi Concept Library has a lesson for each biology concept and shows where it sits in the map. The Fermi Simulation Lab has interactive simulations for ideas that are easier to see than to read.
How can you practise graph questions before the exam?
Try this as a short daily drill:
Take one graph from your NCERT textbook or a CBSE sample paper.
Cover everything except the graph.
Write the axes sentence and the trend sentence in your notebook.
Write the concept link in one line, with the chapter name.
Uncover the question, answer it, and check against the marking scheme.
Parents can help without knowing the biology. Ask three questions: "What is on each axis?", "What happens to the line?" and "Which chapter explains that?" If your child answers all three before looking at the options, the habit is working.