

On this page
Put a few bacteria into a flask of broth, seal it, and count them every hour. The plot is not one smooth rise: it is a flat start, a steep climb, a plateau and a fall. Naming the phases is easy; predicting when each starts is harder.
What are the four phases of the bacterial growth curve?
The definitions below come from the growth-curve section of OpenStax Microbiology, a free university textbook. They describe a batch culture, a closed system where no nutrients are added and most waste is not removed.
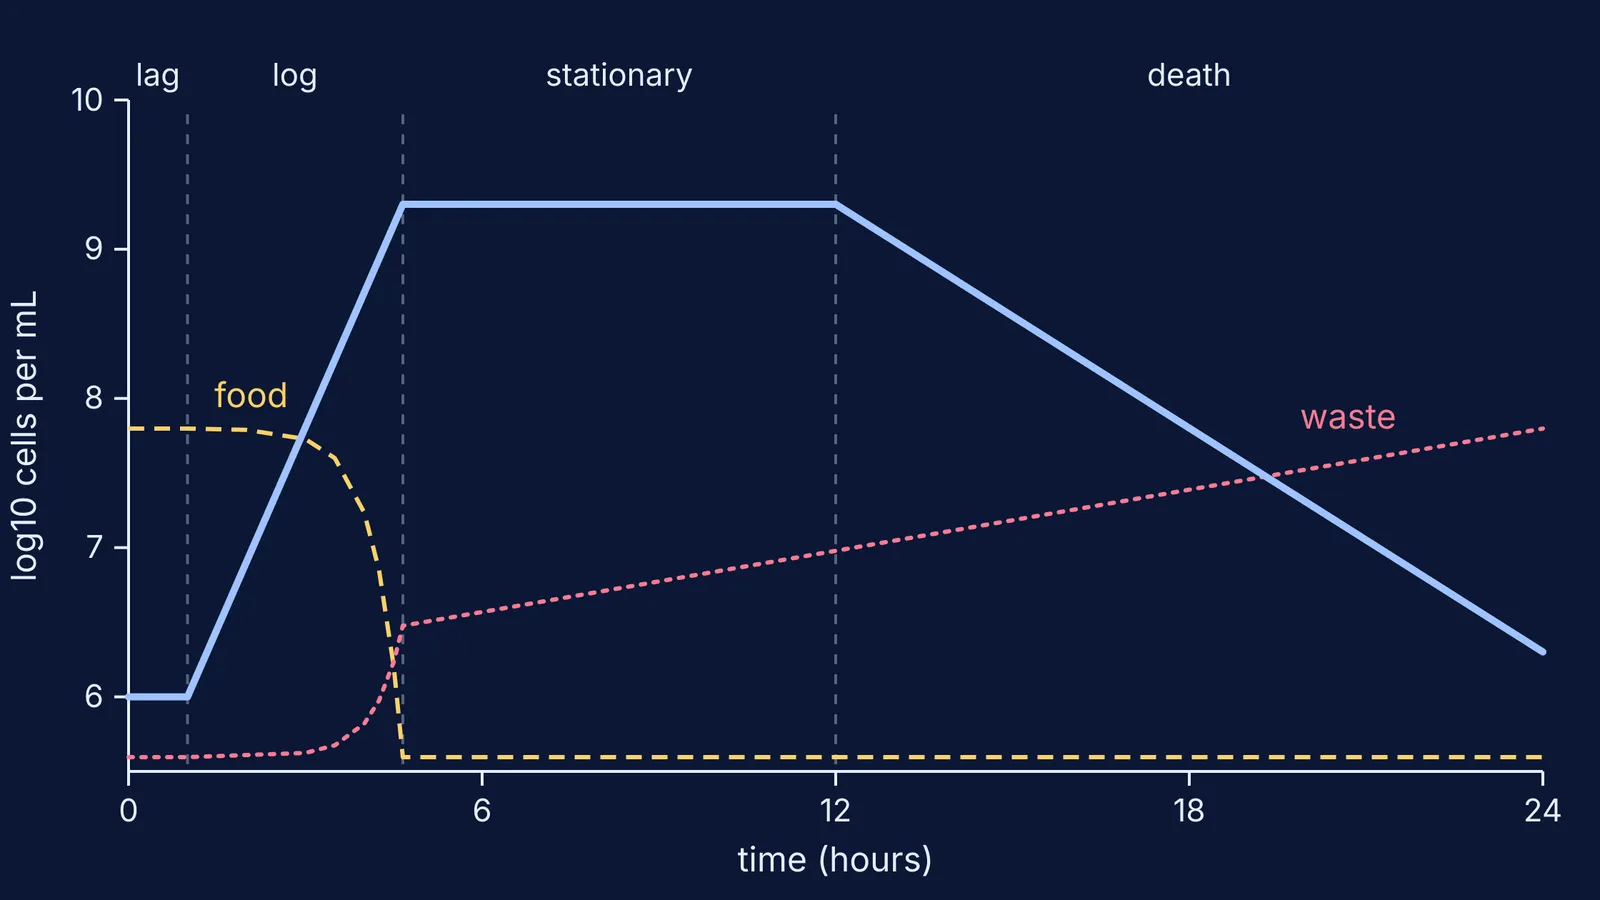
Lag phase: the number of cells does not change, but the cells grow larger, make the proteins they need and repair any damage from the transfer.
Log (exponential) phase: cells divide by binary fission and their number grows exponentially.
Stationary phase: the number of new cells made by division equals the number of cells dying, so the count levels off.
Death (decline) phase: more cells die than divide, so the number falls exponentially.
The same page names what slows growth: waste builds up, nutrients are used up and oxygen runs low.
Why is there a lag phase if the cells are ready to divide?
In a 2012 study in the Journal of Bacteriology, Rolfe and colleagues followed Salmonella through a 2-hour lag phase after moving it into fresh broth. Adaptation began within 4 minutes, and at 20 minutes 945 genes were switched on, including genes for making proteins and for aerobic respiration. The cells also took up iron, calcium and manganese.
So the lag phase is when the cells retool for their new surroundings.
How long does each phase last in a worked example?
OpenStax says E. coli can double in as little as 20 minutes under optimal lab conditions; the other numbers are teaching assumptions.
Start with 1 million cells per mL and assume a 1-hour lag.
Assume the food in the flask can support at most 2 billion cells per mL.
Going from 1 million to 2 billion is a 2,000-fold rise. Since 2 to the power 11 is 2,048, that takes about 11 doublings.
Eleven doublings at 20 minutes each take 220 minutes, or about 3 hours 40 minutes.
So the log phase runs from about 1 hour to about 4 hours 40 minutes, and then the stationary phase begins.
Now change one thing at a time and predict before you calculate:
Double the food. The ceiling rises to 4 billion cells per mL, but that is only one more doubling. The log phase ends just 20 minutes later.
Start with half as many cells. Again one extra doubling, so 20 minutes later.
Use M. tuberculosis instead. OpenStax gives it a generation time of 15 to 20 hours, so the same 11 doublings would take 7 to 9 days instead of an afternoon.
For the maths behind this, our post on exponential growth and decay with dy/dt = ky works through the same idea with formulas.
How do food and waste decide when stationary and death phases start?
OpenStax says cells die in greater numbers as toxic waste accumulates and nutrients are exhausted. The diagram above is a simple model of that. The climb ends when the food runs out. Waste keeps building during the plateau, and we assume it turns harmful about 12 hours in. Deaths then overtake divisions and the count falls tenfold every 4 hours. These timings are teaching assumptions, not measurements.
A chemostat avoids this. OpenStax describes it as a continuous culture where nutrients are supplied at a steady rate and bacterial suspension is removed at the same rate, so food keeps arriving and waste is carried away. See also how bioreactors and downstream processing keep microbes productive.
The decline is not always the end. A 2006 review by Steven Finkel in Nature Reviews Microbiology expands the textbook phases to include a long-term stationary phase, where stressful conditions can select for mutants with a growth advantage in stationary phase (GASP).
How can you practise predicting the curve?
Sketch the curve before you calculate anything.
Mark three times: lag ends, food runs out, waste turns harmful.
Change one variable (food, starting cells, doubling time or waste removal) and redraw.
Check your sketch against a calculation, and explain any gap in one sentence.
Changing one input and watching the bends shift is a good way to check a prediction. The Fermi Simulation Lab has interactive simulations for ideas that are easier to see than to read. If you get stuck on why a phase starts when it does, Fermi's AI tutor can run the simulation with you and check your understanding as you go.


