

On this page
A car keeps moving while you react, then while the brakes work. Speed affects those two stretches very differently, and the best way to feel it is to predict first, then test your prediction with a pencil or a simulation.
What is stopping distance?
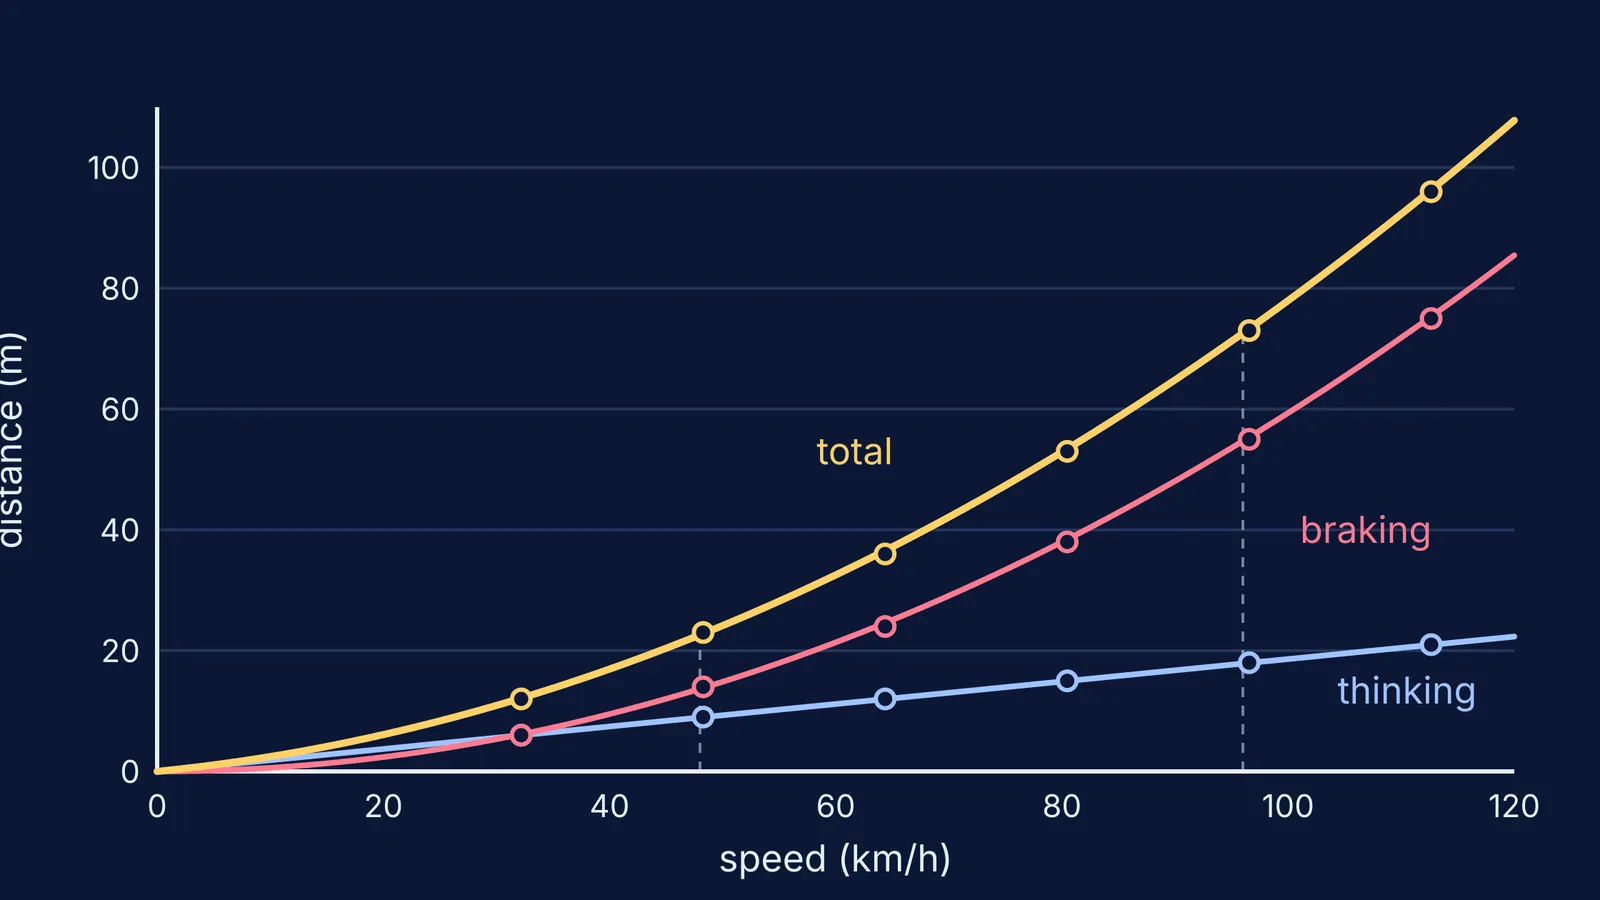
Stopping distance is the thinking distance plus the braking distance, as the UK government's Highway Code stopping distances chart shows.
Thinking distance: how far the car travels at full speed between you seeing a hazard and pressing the brake.
Braking distance: how far it travels from the moment the brakes act until it stops.
The chart gives typical dry-road values. At 30 mph (48 km/h) it lists 9 m thinking plus 14 m braking, 23 m in all. At 60 mph (96 km/h) it lists 18 m thinking plus 55 m braking, 73 m in all. Real distances depend on attention, road surface, weather and the car's condition.
How does speed affect stopping distance?
From 30 to 60 mph, speed doubled. Thinking distance doubled, from 9 m to 18 m. Braking distance went from 14 m to 55 m, nearly four times as far.
Thinking distance is speed multiplied by reaction time, so it grows in a straight line. Braking is different. Friction has to remove all the car's kinetic energy, ½mv², and with the same grip the braking force is the same, so the distance needed is proportional to v². As HyperPhysics on stopping distance puts it, doubling speed quadruples the distance. From v² = u² + 2as with v = 0, you get s = u²/2a; our post on deriving the equations of motion from a velocity-time graph shows where that equation comes from.
Working backwards from the Highway Code chart, each thinking distance divided by its speed gives about 0.67 seconds of reaction time, and s = u²/2a on the braking distances gives a deceleration of about 6.5 m/s².
Try it: five predictions to test
Use a calculator or any braking simulation, and write each prediction down before checking. Use 6.5 m/s², the dry-road deceleration implied by the Highway Code chart, and a reaction time of 1.25 seconds, the estimate for an unexpected but common signal.
Baseline, 50 km/h (13.9 m/s). Thinking: 13.9 x 1.25 = 17.4 m. Braking: 13.9² / (2 x 6.5) = 14.8 m. Total: about 32 m.
Double the speed to 100 km/h (27.8 m/s). Predict first. Thinking doubles to 34.7 m. Braking quadruples to 59.4 m. Total: about 94 m, nearly triple.
Halve the grip at 100 km/h. Deceleration drops to 3.25 m/s². Braking doubles to 118.7 m; thinking is unchanged. Total: about 153 m.
Double the reaction time at 100 km/h (2.5 s). Thinking doubles to 69.4 m; braking is unchanged. Total: about 129 m.
Find the crossover. With these values, 2 x 6.5 x 1.25 = 16.25 m/s, about 58 km/h. Slide the speed past it and watch braking distance overtake thinking distance.
The pattern: reaction time scales only thinking distance, grip scales only braking distance, and speed scales both, braking by its square.
Why does reaction time matter so much?
The 0.67 seconds implied by the Highway Code chart is a quick reaction. Reviewing many braking studies, Marc Green (2000), Transportation Human Factors found that expectation was the biggest factor, changing reaction times by a factor of 2. Drivers who knew when and where a brake signal would come took about 0.70 to 0.75 seconds. An unexpected but common signal, such as the brake lights of the car ahead, took about 1.25 seconds. A surprise, such as an object suddenly moving into the road, took roughly 1.5 seconds.
A distracted driver travels further before braking even starts, and that gap grows with speed. Batters face the same problem, as we explore in how reaction time works against a fast bowler.
What do wet or icy roads do to stopping distance?
Less grip means less deceleration. The Highway Code's adverse weather rules say stopping distances in wet weather will be at least double those on dry roads, and that in icy or snowy weather they can be ten times greater. Its rule 126 adds a simple habit: keep at least a two-second gap on fast roads, at least doubled in the wet. Anti-lock brakes help you steer while braking hard (see how ABS brakes stop skidding), but cannot create grip the road lacks.
The Ministry of Road Transport and Highways' Road Accidents in India 2022 release reports 1,68,491 road deaths in 2022. Worldwide, the WHO road traffic injuries fact sheet says every 1% increase in mean speed produces a 4% increase in fatal crash risk.
Next time you are a passenger, pick the speed on the dashboard, say your predicted stopping distance out loud and picture it on the road ahead. Then check the five predictions above, and explore more ideas that are easier to see than read in the Fermi Simulation Lab.


