On this page
Say you top the class mock with 225 out of 300. Two weeks later, with the same syllabus and the same effort, you get 187. What changed? Often, nothing. Part of the first score was luck, and luck does not turn up on demand.
Why do toppers in one test often score lower next time?
Statisticians call it regression to the mean. A review in the International Journal of Epidemiology describes it as a statistical phenomenon that "can make natural variation in repeated data look like real change" (Barnett and colleagues, International Journal of Epidemiology).
It happens when unusually large or small measurements tend to be followed by measurements closer to the average. The same review says the effect becomes more noticeable as measurement error grows, and when follow-up is looked at only in a group selected on its first result (Barnett and colleagues). "The top ten of the last mock" is exactly that kind of group.
Francis Galton wrote about "regression towards mediocrity" in an 1886 paper on the heights of parents and their children (Galton, Journal of the Anthropological Institute).
What happens when you simulate scores as skill plus luck?
Here is a spreadsheet model with made-up, easy numbers. It recreates what the Barnett review warns about: noisy scores, and a group picked on its first result.
10,000 students take a test out of 300.
Each student's skill (their score on an ordinary day) is spread around 150, with a standard deviation of 30 marks.
Luck (which questions came up, sleep, a silly slip) adds or takes away marks, with a standard deviation of 30, drawn fresh for every test.
Score = skill + luck. Nobody's skill changes before the retest.
Now pick the top 10% on test 1. Using the normal distribution, this is what to expect on average:
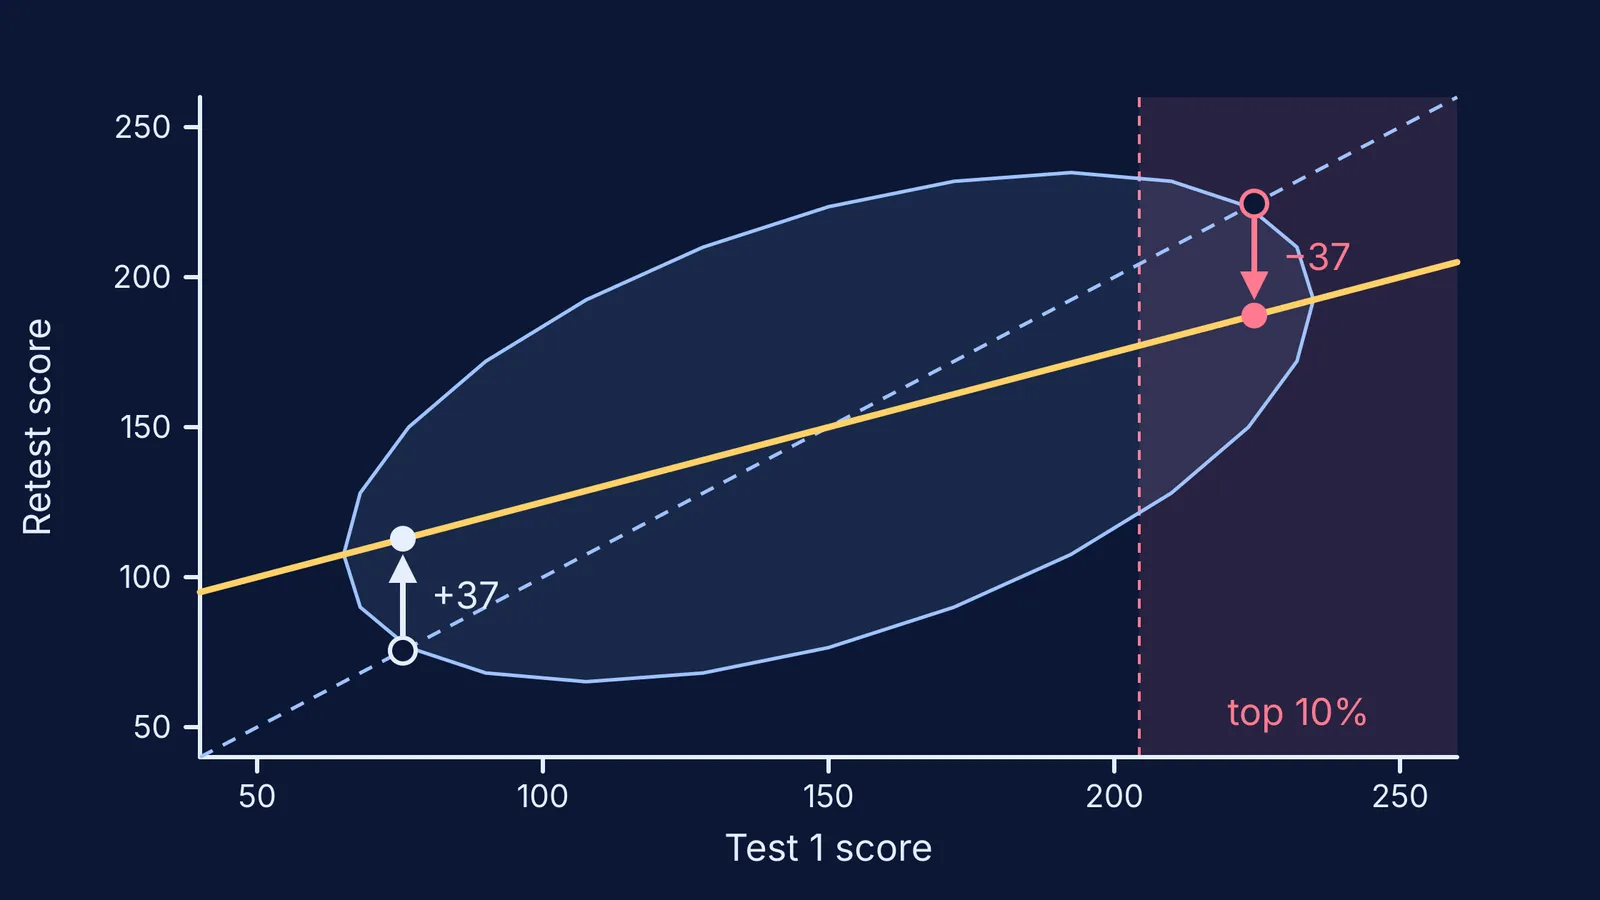
The top-10% cut-off is about 204, and the group averages about 225: 75 marks above the class average of 150.
Skill and luck have the same spread, so half that lead is skill and half is luck. Average skill is about 187; average luck was about +37.
On the retest, luck averages zero again, so the group averages about 187: a drop of about 37 marks with no change in ability.
The bottom 10% does the mirror image, rising from about 76 to about 113.
The class average is 150 both times. The extremes move towards the middle.
The rule behind the model is short: expected retest = class average + r × (your score − class average), where r is the correlation between the two tests. With equal skill and luck, r is 0.5, so you keep half your distance from the average.
The yellow line in the chart at the top of this post is the same idea as fitting a line to marks and study hours.
To see luck at work, read why averages of dice rolls form a bell curve. Or explore the Fermi Simulation Lab, which has interactive simulations for ideas that are easier to see than to read.
Does a lower score on the retest mean you got worse?
Not on its own. In the model, a student whose skill is flat still drops after a lucky high score, and a jump after a bad test is partly luck returning to normal.
Scold after a low score and the next one is often higher anyway, so scolding seems to work. Praise after a high score and the next is often lower, so praise seems to backfire. Neither did what it appeared to do.
For more on reading a run of scores, see why mock test scores fluctuate so much.
How should you read your next mock result?
Before deciding anything:
Write down your last four or five scores and their average.
If the new score sits inside your usual range, treat the change as noise.
After a high score, note what went right, but plan around your average, not your peak.
After a low score, sort the lost marks into concept, method, careless and time. Only concept and method gaps call for a change in how you study.
Wait for two more results before calling it a trend.
For parents, two lines that keep the conversation calm:
"That's above your usual range, well done. Let's see where the next two land before we change anything."
"That's below your usual range. Let's look at which questions cost marks before we decide what it means."
If step 4 turns up a concept gap, the Fermi Concept Library has every concept in physics, chemistry, biology, mathematics and computing, each with its own lesson, so you fix the idea and not just the question.
If results leave you or your child anxious for days, talk to someone you trust or a professional. In India, the free Tele MANAS helpline is reachable on 14416 (Press Information Bureau).
Next time a topper slips, check the average before you look for a cause.