On this page
Drag a slider on y = ax² + bx + c and the curve moves. The trap is that watching feels like learning. The fix: say what will happen before you move the slider, then check. Here is the rule that makes those predictions possible, a worked example and a 15-minute plan.
Why does the sign of b² − 4ac decide where the parabola meets the x-axis?
In the quadratic formula, the value under the square root, b² − 4ac, is called the discriminant (OpenStax Intermediate Algebra, section 9.3), written Δ here. The discriminant also counts the parabola's x-intercepts: two when b² − 4ac > 0, one when it equals 0, and none when it is negative (OpenStax Intermediate Algebra, section 9.6).
Positive: the parabola cuts the x-axis twice (two distinct real roots).
Zero: the vertex sits on the x-axis, so the parabola touches it (one repeated root).
Negative: the parabola misses the x-axis (no real roots).
Why: completing the square gives y = a(x + b/2a)² − Δ/4a, so the vertex sits at height −Δ/4a. For an upward parabola (a > 0), a positive Δ puts the vertex below the axis, so the arms cross it twice; zero puts it on the axis; negative puts it above. For a < 0 everything flips and the rule still holds.
What does each slider do to the parabola?
c moves the whole graph straight up or down (it is the y-intercept). With a > 0, raising c can only reduce the number of roots.
a sets width and direction. Flipping its sign turns the parabola over, and changing its size also moves the vertex, since both −b/2a and −Δ/4a contain a.
b is the surprise. It slides the vertex along the curve y = c − ax², a parabola through (0, c) opening the other way. So for an upward parabola, a large enough b always drags the vertex below the axis.
A shortcut: if a and c have opposite signs, −4ac is positive, so Δ > 0 whatever b is: two roots, always. The reverse question, when the graph stays above the axis for every x, is in our post on when ax² + bx + c is positive for all x.
Can you predict the number of roots before you slide?
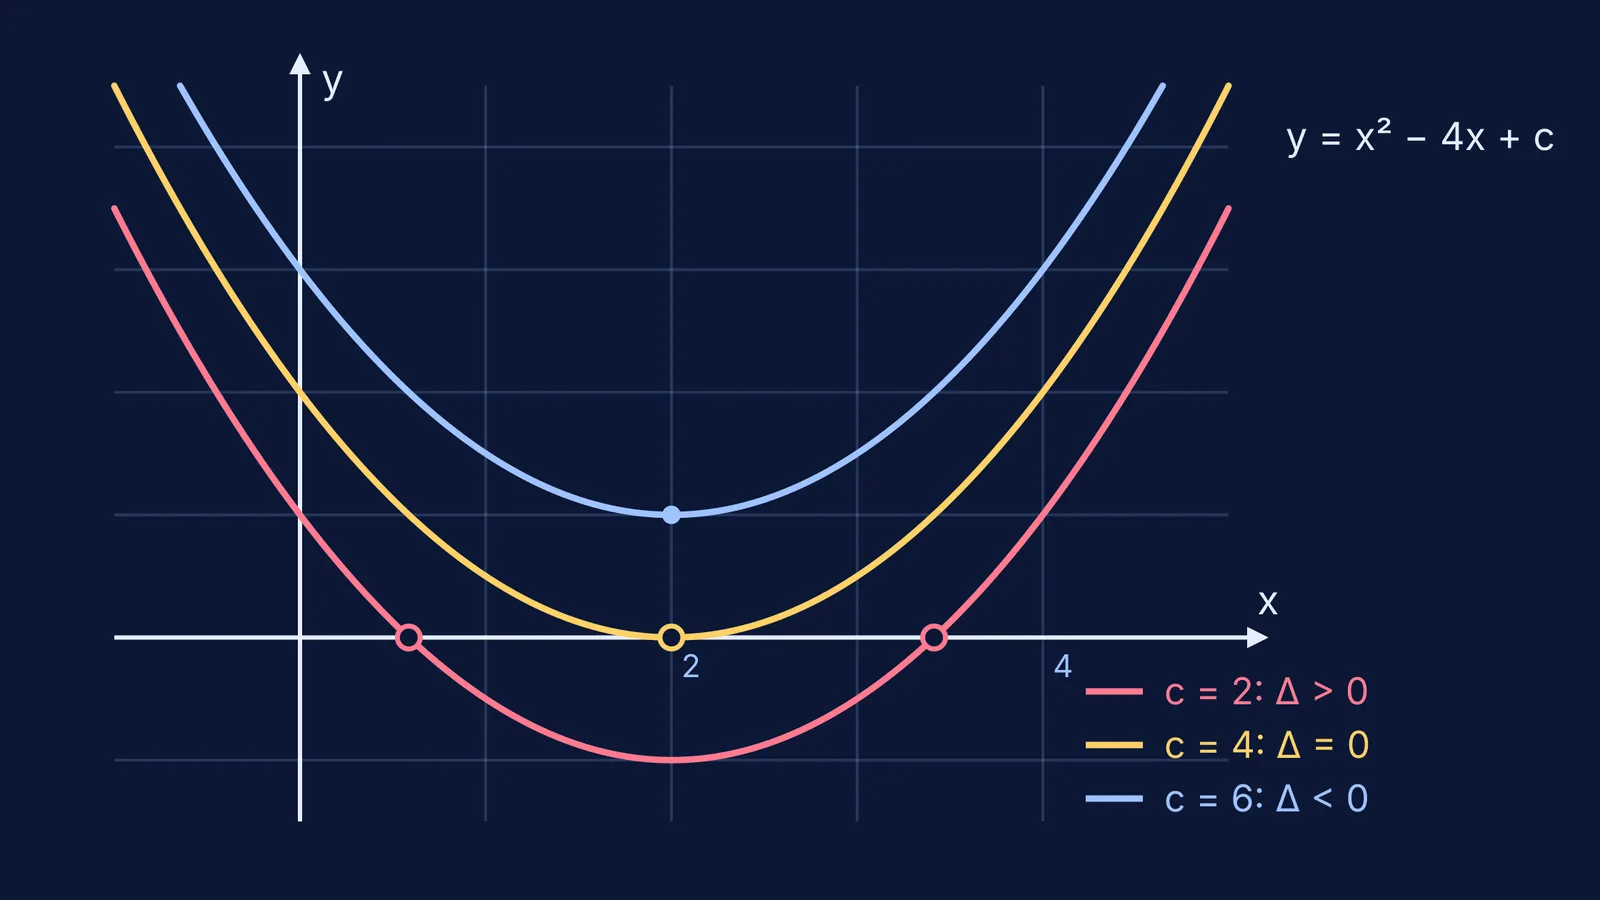
Take y = x² − 4x + c, the curves in the image above. Here a = 1 and b = −4, so Δ = 16 − 4c.
c = 2: Δ = 8. Prediction: cuts twice, at about 0.59 and 3.41 (2 ± √2).
c = 4: Δ = 0. Prediction: touches at x = 2, since the expression is (x − 2)².
c = 6: Δ = −8. Prediction: misses; the vertex is at (2, 2).
Slide c from 0 to 8 and the two roots close in, merge at x = 2, and vanish. Now set a = −1 and keep b = −4, so Δ = 16 + 4c. Which values of c give no real roots? (Answer: c < −4.)
Do sliders actually help you learn quadratics?
There is some evidence that they do. At the University of Duisburg-Essen, Lisa Göbel, supervised by Bärbel Barzel, ran an intervention study with 379 secondary-school students in Germany on the parameters of f(x) = a(x − b)² + c over three 45-minute lessons (project poster). One group had no visualisation; the others used a static function plotter, drag mode or sliders.
In the slider group, 80.0% of students' summary sheets were rated mainly sound, and 82.4% in the drag-mode group, against 56.3% with no visualisation and 47.8% with the plotter, the same poster reports. Students also used the technology to test their own hypotheses. The full study appeared as a 2021 book (Springer, DOI 10.1007/978-3-658-32637-1).
Two cautions: these were guided tasks ending in written rules, not free play, and the study looked at parameters, not the discriminant. So pair the slider with a prediction and a sentence you write down.
How should you practise with a quadratic graph slider?
Minutes 0 to 3: with a = 1 and b = 0, slide only c. Predict where the roots disappear, then check.
Minutes 3 to 7: with a = 1 and c = 3, slide b. Predict when two roots appear (b² > 12, so b beyond about ±3.46).
Minutes 7 to 11: give a and c opposite signs and try to make the parabola miss the axis. Explain in one sentence why you can't.
Minutes 11 to 15: close the graph. Solve three nature-of-roots questions on paper and sketch each graph from its Δ alone.
For JEE questions on roots in an interval, see our guide to the nature and location of roots. On using graphing apps without letting them think for you, read using graphing tools to learn functions and calculus.
The Fermi Simulation Lab has interactive simulations for ideas that are easier to see than to read. If the algebra behind the shape is the gap, the Fermi Concept Library gives each mathematics concept its own lesson.