

On this page
Most of us learn periodic trends as rules, until an exam asks why boron breaks one. Plot the real numbers for elements 1 to 20, guess the shape before you look, and explain every point where your guess was wrong. This is the trend material in NCERT Class 11 Chemistry, Unit 3.
Where do you get data for periodic trend graphs?
Use one consistent table per property, so every element is on the same footing:
Ionisation energy: the NIST Atomic Spectra Database gives critically evaluated first ionisation energies of neutral atoms in eV.
Atomic radius: single-bond covalent radii from Cordero and colleagues, "Covalent radii revisited" (Dalton Transactions, 2008), tabulated on Wikipedia's covalent radius page.
Electronegativity: Pauling values, listed on Wikipedia's electronegativity data page), which draws on Allred's 1961 paper80142-5).
Watch which radius you download. The PubChem periodic table file gives boron's radius as 192 pm and beryllium's as 153 pm, and PubChem's boron record shows that 192 pm is a van der Waals radius; boron's covalent radius is 84 pm.
What shape should each periodic trend graph make?
Before you plot, write down three predictions on paper. Ours would be:
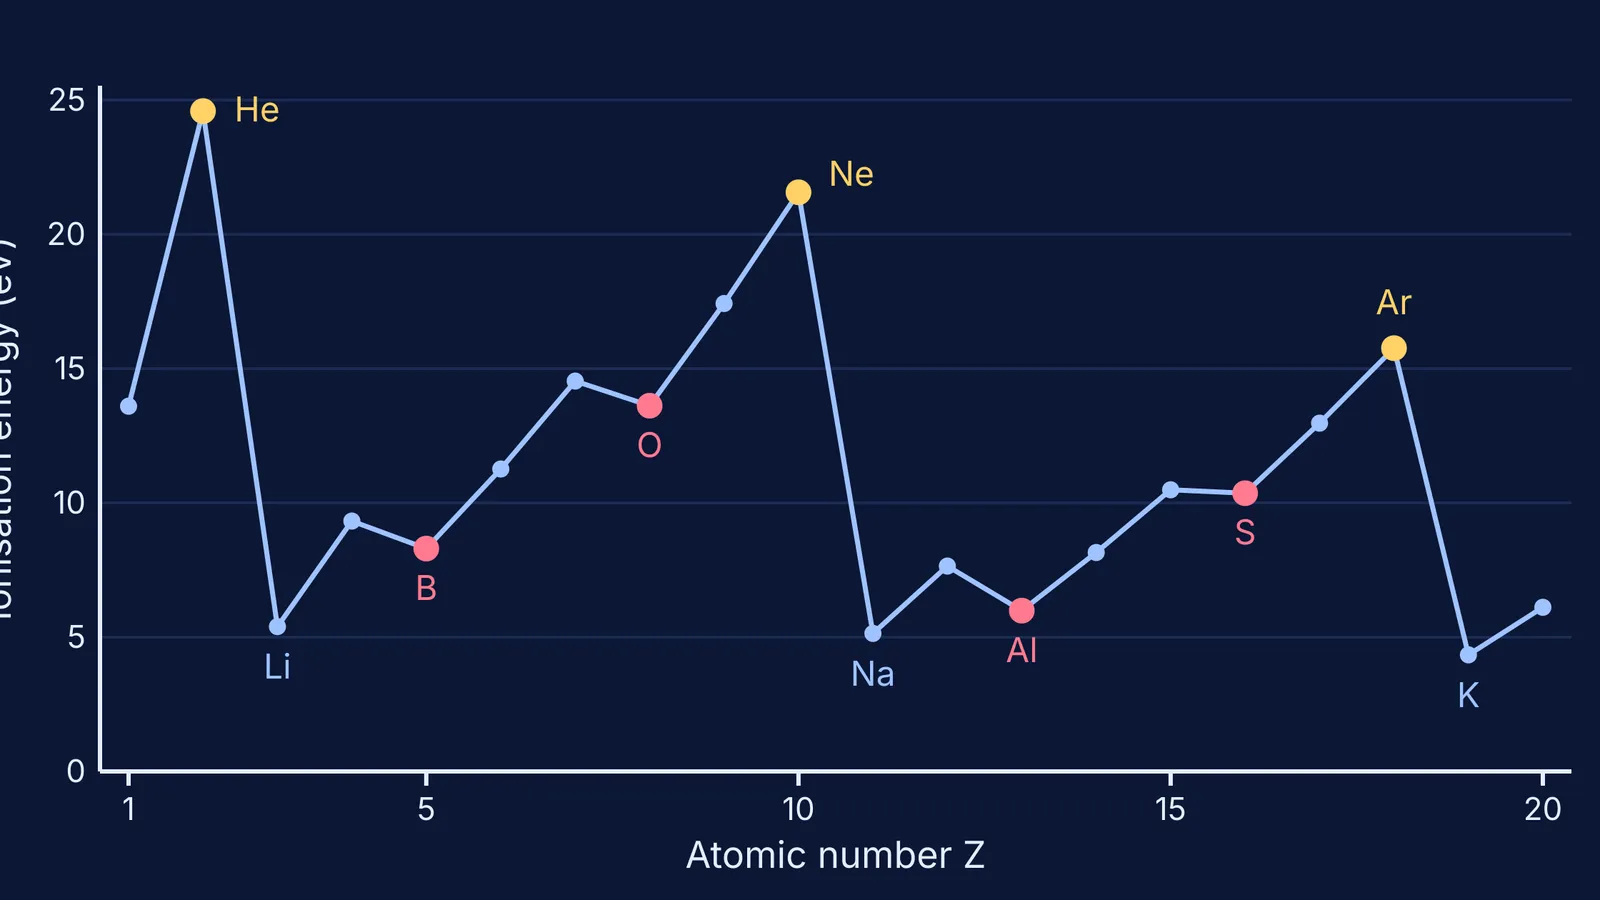
Ionisation energy climbs across each period, peaks at the noble gas, then crashes at the next alkali metal.
Radius does the opposite: shrinks across a period, then jumps up when a new shell starts.
Electronegativity rises across each period and resets at the next group 1 metal.
This is the sketch-before-you-plot habit applied to chemistry: wherever the plotted line leaves your sketch, you have something to explain.
Why does ionisation energy dip at boron and oxygen?
From the NIST values, your graph should show four places where the line drops when you expected it to rise:
Beryllium 9.32 eV, then boron 8.30 eV.
Nitrogen 14.53 eV, then oxygen 13.62 eV.
Magnesium 7.65 eV, then aluminium 5.99 eV.
Phosphorus 10.49 eV, then sulfur 10.36 eV.
The p-electron dip (B after Be, Al after Mg). Boron's outermost electron sits in a 2p orbital. A 2p electron is higher in energy than a 2s electron, and the filled 2s pair partly screens it from the nucleus. Removing it costs less, even though boron has one more proton. Aluminium repeats this one shell out, with 3p and 3s.
The paired-electron dip (O after N, S after P). Nitrogen's three 2p electrons each have their own orbital. Oxygen's fourth 2p electron has to share an orbital with another electron. The two repel each other, so one of them leaves more easily.
The big jumps. Helium, neon and argon are the peaks because a full shell holds its electrons tightly. Lithium, sodium and potassium are the floor: the next electron starts a new shell, farther out and screened by every shell inside it. Potassium, at 4.34 eV, is the lowest of the 20.
For more practice reading this graph the way exam questions present it, see our walkthrough of the ionisation enthalpy vs atomic number graph.
Why does atomic radius shrink across a period and jump at a new shell?
The Cordero covalent radii fall from lithium (128 pm) to fluorine (57 pm), and from sodium (166 pm) to chlorine (102 pm). Across a period each new proton pulls harder, but each new electron goes into the same shell and adds little screening, so the cloud is drawn in. Then potassium jumps to 203 pm because it starts a fourth shell.
Leave the noble gases out of this plot, or mark them separately. They hardly form covalent bonds, so a covalent radius for neon is not the same kind of number as one for fluorine.
Why is electronegativity the smoothest of the three?
On the Pauling scale), values climb from lithium (0.98) to fluorine (3.98) and from sodium (0.93) to chlorine (3.16), with no dip at boron or oxygen. Electronegativity describes how strongly an atom pulls on electrons it shares in a bond. It does not measure what it costs to remove one electron from a lone atom, so the subshell details behind the ionisation dips do not show up the same way. Noble gases have no Pauling value here, so your line will have gaps.
How do you turn this into one study session?
Copy the values for each property into a spreadsheet, atomic number in the first column.
Write your three predictions without looking at any charts.
Plot all three graphs as lines with points.
Circle every point that breaks your prediction and explain each one in a sentence.
If a sentence won't come, the lesson on that idea in the Fermi Concept Library is a good place to fill the gap. For ideas that are easier to see than to read, the Fermi Simulation Lab has interactive simulations. Use them the same way as this exercise: predict first, then test.


