On this page
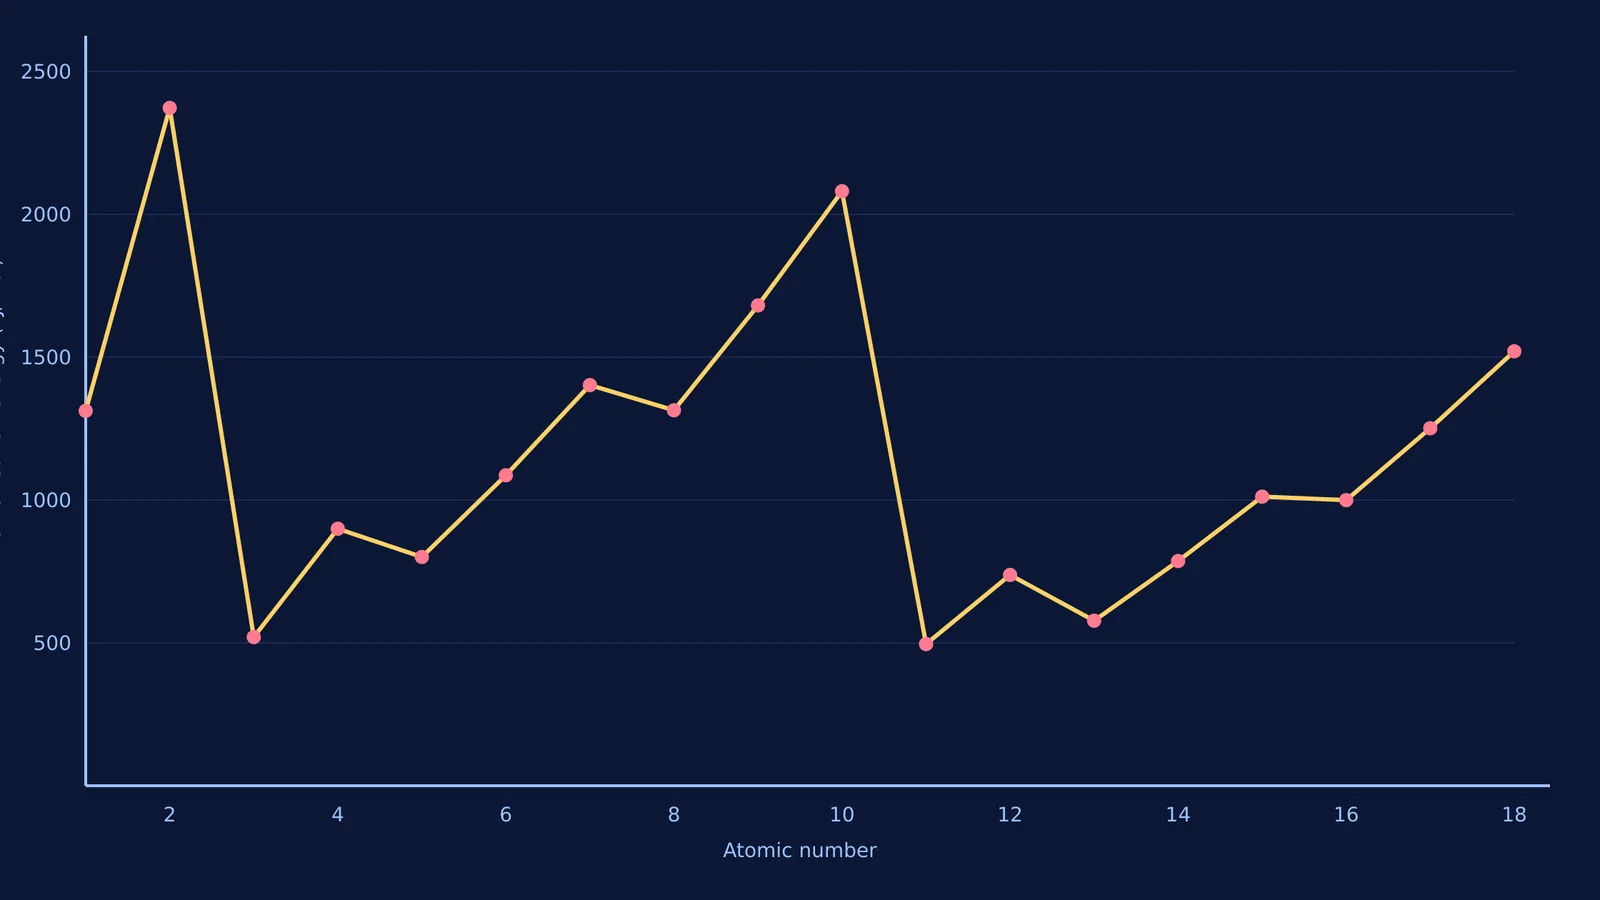
The first ionisation enthalpy of an element is the minimum energy needed to remove the most loosely bound electron from a neutral, gaseous atom. When you plot this energy against the atomic number, you do not get a straight line. Instead, the graph rises and falls in a repeating pattern.
According to data compiled by Wikipedia, the energy generally increases from left to right across a period as the effective nuclear charge grows. However, the graph is famous for its jagged shape: sharp peaks, deep troughs, and a few small dips that reveal exactly how electrons arrange themselves around the nucleus.
Why does the graph peak at the noble gases?
The highest points on the graph in each period are the noble gases (helium, neon, argon). For example, helium takes a massive 2372.3 kJ/mol to ionise. Neon has a first ionisation energy of 2080.7 kJ/mol, slightly lower than helium, but still forming a prominent peak in the second period. Argon follows at 1520.6 kJ/mol, continuing the trend.
These elements have a complete valence shell, such as a stable octet or a full 1s shell for helium. Because the shell is full, the effective nuclear charge pulling on those electrons is the strongest in that period. The atom holds its electrons tightly, making it very hard to remove one.
As you move down the noble gas group from helium to radon, the peaks get lower. The outermost electrons are in higher energy levels, further from the nucleus, so they are easier to remove.
Why are the troughs at the alkali metals?
Immediately after each peak, the graph drops sharply to a trough. These lowest points belong to the alkali metals (lithium, sodium, potassium). Lithium, for instance, drops all the way down to 520.2 kJ/mol. Sodium, in the third period, has a similarly low ionisation energy of 495.8 kJ/mol, confirming that the trend of deep troughs repeats predictably as each new electron shell begins to fill.
An alkali metal has a single valence electron sitting in a brand new principal energy level. This lone electron is heavily shielded from the nucleus by all the inner "core" electrons from the previous shells. Removing this single, distant electron leaves behind a highly stable, noble-gas-like core. Because losing the electron brings the atom to a stable state, the process takes very little energy.
Why does the graph dip at boron and aluminium?
If ionisation energy generally increases across a period, you might expect a smooth climb from lithium up to neon. But the graph dips at group 13.
The energy drops from beryllium (899.5 kJ/mol) to boron (800.6 kJ/mol), and it drops again from magnesium (737.7 kJ/mol) to aluminium (577.5 kJ/mol).
This happens because we move from an s-subshell to a p-subshell. In beryllium, you are removing an electron from a full, relatively stable 2s orbital. In boron, the outermost electron is in a 2p orbital. The 2p orbital is slightly higher in energy and further from the nucleus than the 2s orbital. The inner 2s electrons also shield the 2p electron, making it easier to pull away.
Why does the graph dip again at oxygen and sulphur?
There is a second dip at group 16. The ionisation energy drops from nitrogen (1402.3 kJ/mol) to oxygen (1313.9 kJ/mol), and from phosphorus (1011.8 kJ/mol) to sulphur (999.6 kJ/mol).
This dip comes down to electron-electron repulsion. Nitrogen has a half-filled 2p subshell, with one electron sitting alone in each of the three p-orbitals. This is a balanced, stable arrangement.
In oxygen, the fourth p-electron has to pair up with another electron in an already occupied orbital. These two negative charges in the same tight space repel each other. This repulsion makes it easier to remove one of the paired electrons, dropping the ionisation energy below that of nitrogen.
To see how these subshells fill up in more complex atoms, look at the rules for the electronic configuration of ions like Fe³⁺ and Cu⁺. You can also compare this atomic energy to the energy needed to break a solid lattice into gas atoms by studying enthalpies of atomisation and sublimation.
If electron configurations are hard to picture, the Concept Library contains every concept in physics, chemistry, biology, mathematics and computing, each with its own lesson and its place in the map. Most learning tools answer questions. Fermi's AI tutor teaches — it holds a line of reasoning across a whole session, notices where a student is stuck, and decides whether to explain, ask, or show.
A checklist for reading periodic trend graphs
When a question asks you to identify elements from an unlabelled ionisation graph:
Find the peaks: These are your group 18 noble gases.
Find the troughs: These are your group 1 alkali metals, marking the start of a new period.
Spot the first dip in a period: This is group 13 (boron, aluminium), marking the jump from an s-orbital to a p-orbital.
Spot the second dip: This is group 16 (oxygen, sulphur), marking the first paired electron in a p-orbital.
Count the steps: You can work out any element's group by counting its position relative to the nearest peak or trough.