On this page
If you clench and unclench your fist as fast as you can for one minute, you will feel a deep burn in your forearm before the time is up. According to the NIH Toolbox project, which mapped normative data across the US population, the average dominant-hand peak grip strength for young men is 49.7 kg, and 30.5 kg for women (Wang et al., 2018). But achieving peak strength is very different from sustaining it. Maintaining even a fraction of that mechanical force requires a constant, uninterrupted supply of cellular energy.
When you repeat the movement without resting, your muscle fibers rapidly consume their available stores of adenosine triphosphate (ATP). The central nervous system continues sending signals to contract, but the physical structures inside the arm cannot keep up. We can measure this onset of metabolic fatigue simply and accurately by tracking how your clenching rate slows down over a continuous sixty-second window.
How to set up the fist-clenching experiment?
This is a standard active-learning experiment that requires no laboratory equipment. You only need a stopwatch, a pen, and a piece of paper to record your data.
The Control (Lowered Arm): Stand up straight and hold your dominant arm down by your side in a relaxed, neutral position.
The Execution: Start the timer. Clench your fist completely (fingers tight into the palm) and then open it fully, extending the fingers, as fast as you physically can.
The Measurement: Have a friend call out the time every ten seconds (at ten, twenty, thirty, forty, fifty, and sixty seconds). At each prompt, write down the exact number of complete clenches you managed in that specific ten-second block.
The Recovery: Rest for exactly five minutes to allow your cardiovascular system to clear out the metabolites and restore baseline oxygen levels in the tissue.
The Variable (Raised Arm): Repeat the exact same test, but this time raise your arm straight up above your head, maintaining a fully raised position for the entire minute.
Why does arm position change the results?
When your arm is lowered, gravity assists your circulatory system. It helps pull arterial blood down into your forearm, delivering fresh oxygen and glucose while simultaneously flushing out metabolic waste products like inorganic phosphates.
When you raise your arm above your head, the mechanics of perfusion change entirely. Your heart must now pump blood uphill against gravity. A clinical study evaluating the standardized elevated arm stress test (sEAST) confirmed that maintaining an elevated arm position allows researchers to reliably measure this rapid decrease in grip strength (Pesser et al., 2022). Without sufficient blood flow, oxygen delivery drops sharply. The muscle cells are forced to rely on anaerobic respiration, causing fatigue-inducing metabolites to become trapped inside the muscle tissue.
This immediate loss of power is a classic demonstration of metabolic fatigue (Wikipedia). It is a completely different biological mechanism from the delayed onset muscle soreness (DOMS) you experience the next day, which we detail in our guide on why muscles ache a day after exercise. Furthermore, if you are preparing for exams like NEET-UG, you will recognise that the forearm relies heavily on fast-twitch fibers for rapid movements. These fibers fatigue much faster than the endurance-focused tissues discussed in our breakdown of red vs white muscle fibres.
How to predict and plot your clench rate?
Before you run the physical test, create a hypothesis. A healthy, rested student might easily manage thirty to thirty-five clenches in the first ten seconds. However, because metabolic fatigue compounds, you will not be able to hold that pace.
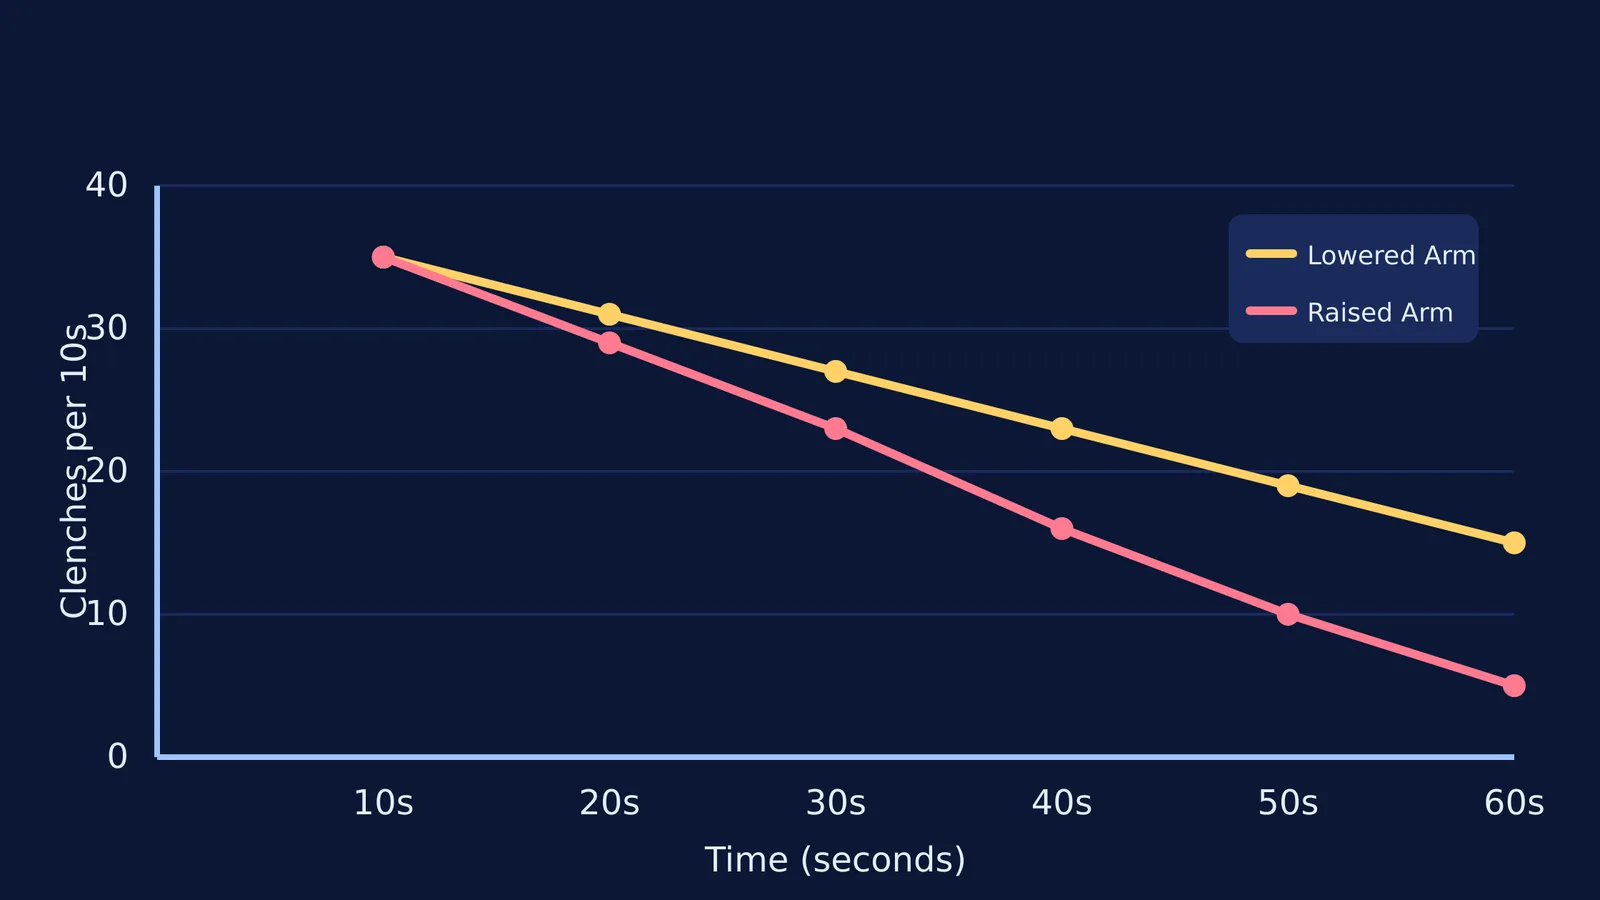
Lowered arm prediction: You will likely see a gradual, steady slope. Your count might drop from thirty-five in the first window to roughly fifteen clenches in the final ten seconds, as the muscle shifts from readily available ATP to slower energy pathways.
Raised arm prediction: You should expect a much steeper drop-off. Denied adequate blood flow, the muscle exhausts its local energy stores faster, potentially plunging to fewer than ten clenches in the final window.
If you want to visualise these biological processes dynamically without running the physical experiment yourself, you can use the Fermi Simulation Lab. Interactive simulations allow you to tweak variables like blood flow, oxygen delivery, and ATP consumption rates, letting you see exactly how energy depletion forces the muscle fibers to slow their contraction cycle.
Once you have recorded your real-world data, plot it on a line graph. Place time (zero to sixty seconds) on the horizontal X-axis and the number of clenches on the vertical Y-axis. You should end up with two distinct curves. The area between the lowered arm curve and the raised arm curve is not just a mathematical curiosity; it visually represents the mechanical cost of fighting gravity for blood flow.
If you struggle to understand the underlying cellular respiration equations that drive these curves, Fermi's AI tutor can work through the metabolic pathways with you step by step. The tutor helps ensure you understand the deep connection between a gross physical movement and the microscopic chemistry happening inside the cell.