

On this page
Most students can write down the formula for rms speed. Fewer can say what happens to the whole graph of molecular speeds when the gas gets hotter. This post gives you that picture, plus a routine: heat a gas in a simulation, but write your predictions down first.
What does the Maxwell speed distribution graph show?
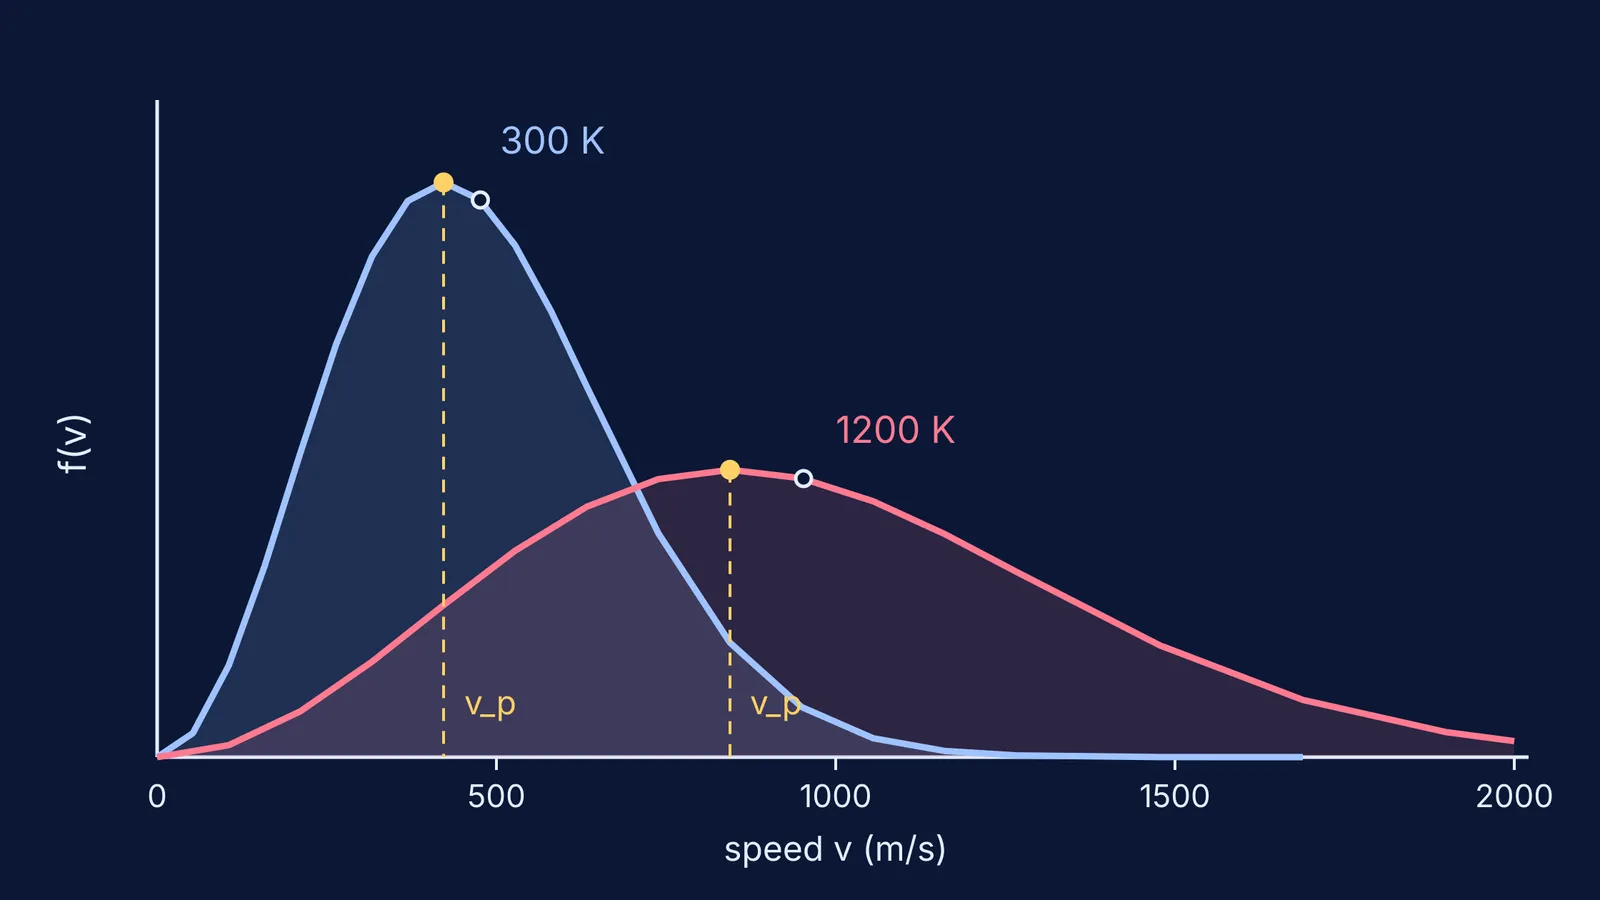
The curve f(v) tells you what fraction of molecules have speeds near v. The fraction with speeds between two values is the area under the curve between them. Because every molecule has some speed, the total area under the curve is exactly 1, the normalisation condition given in OpenStax University Physics, Volume 2, section 2.4.
The same OpenStax section gives the formula: f(v) = 4π(m/2kT)^(3/2) v² e^(−mv²/2kT). The v² factor makes the curve start at zero; the exponential kills off high speeds. The result is a lopsided curve with a long tail to the right.
How does the Maxwell speed distribution change with temperature?
The Maxwell-Boltzmann distribution "is shifted to higher speeds and broadened at higher temperatures", according to OpenStax. The LibreTexts chemistry module on Maxwell-Boltzmann distributions/Kinetics/03%3A_Rate_Laws/3.01%3A_Gas_Phase_Kinetics/3.1.02%3A_Maxwell-Boltzmann_Distributions) says the same thing more plainly: as the temperature rises, the distribution flattens out.
Put those together and you get three changes that always happen at once:
The peak moves right. The typical molecule is faster.
The curve spreads out. Speeds now range over a wider band.
The peak gets lower. The area must stay 1, so a wider curve has to be shorter.
The third point is the one students miss. If you sketch the hot curve taller as well as wider, its area is more than 1: you have counted more molecules than the gas contains.
Where do the most probable, mean and rms speeds sit?
There are three standard speeds, and OpenStax gives all three formulas in the same section:
Most probable speed: v_p = √(2RT/M), the speed at the peak.
Mean speed: v_avg = √(8RT/πM).
Root-mean-square speed: v_rms = √(3RT/M).
The square-root factors 2, 8/π ≈ 2.55 and 3 fix the order v_p < v_avg < v_rms at every temperature. The mean is about 1.13 times v_p and the rms speed about 1.22 times v_p. The mean sits to the right of the peak because the long right-hand tail pulls the average up.
How fast are nitrogen molecules at 300 K and 1200 K?
Using the OpenStax formulas with R = 8.314 J/(mol K) and M = 0.028 kg/mol for nitrogen, we worked out these values:
At 300 K: v_p ≈ 422 m/s, v_avg ≈ 476 m/s, v_rms ≈ 517 m/s.
At 1200 K, four times hotter: v_p ≈ 844 m/s, v_avg ≈ 953 m/s, v_rms ≈ 1034 m/s.
Every speed has doubled, because each one grows as √T and √4 = 2.
The gap between peak and mean grows from about 54 m/s to about 108 m/s. The ratios stay fixed, but the curve is twice as wide, so the gaps double too.
The peak height halves. From the formula, the peak value is 4/(√π · e · v_p), about 0.0020 per m/s at 300 K and 0.0010 per m/s at 1200 K.
How do you test your predictions in a simulation?
Any gas simulation that shows a speed histogram works. Use this routine so the simulation checks your thinking instead of doing it for you:
Write the starting temperature and note where the histogram peaks.
Before heating, predict in writing: new peak speed, whether the peak will be higher or lower, and roughly how wide the spread will be. Since v_p = √(2RT/M) (OpenStax), doubling T should make your new peak about 1.41 times the old one.
Heat the gas, wait for the histogram to settle, then compare. Did the peak move as far as √T says?
Check the area. Did the bars get shorter as they spread out?
Now keep T fixed and switch to a heavier gas. Predict first: since M is in the denominator, the curve should move left and get taller.
If you want a place to try this, the Fermi Simulation Lab has interactive simulations for ideas that are easier to see than to read. And if the √T scaling itself is the shaky part, Fermi's AI tutor works out what you already know and decides whether to explain, ask or show.
Where does this graph show up next?
The tail of this curve explains a lot. It is why some molecules escape a planet even when the rms speed is well below escape speed, which we cover in why the Moon has no atmosphere. The M in the denominator is behind Graham's law of diffusion for light and heavy gases. And if you mix up R and k in these formulas, see how the Boltzmann constant relates to the gas constant.
Next time you see two Maxwell curves in a question, check three things: which peak is further right, which is lower, and whether the areas match.


