On this page
Motion graphs look simple until a question asks what the object is actually doing. Physics education researcher Robert Beichner built a test of kinematics graphs and collected data from 895 high school and college students. His paper lists a consistent set of difficulties: reading the graph as a picture of the path, mixing up slope and height, finding slopes of lines that miss the origin, and saying what the area under a curve means.
Here is a routine for those doubts: turn the graph into text, ask an AI tutor to tell the story of the motion, then test it with slope and area.
Why are position, velocity and acceleration graphs so confusing?
Lillian McDermott and colleagues studied several hundred university students over several years. In their 1987 paper in the American Journal of Physics, they sorted the errors into two groups: trouble connecting a graph to physics concepts, and trouble connecting a graph to real motion.
The fix is to hold on to three rules, all stated in NCERT Class 11 Physics, Chapter 2, Motion in a Straight Line:
Velocity at an instant is the slope of the tangent to the position-time graph.
Acceleration at an instant is the slope of the tangent to the velocity-time graph.
The area under a velocity-time graph is the displacement over that time interval.
Can an AI tutor read a motion graph correctly?
Partly. Giulia Polverini and Bor Gregorcic gave ChatGPT-4 a test of understanding graphs in kinematics, using its image input. Their 2024 study in Physical Review Physics Education Research found that, on average, it performed about as well as students taking a high-school physics course. It was good at proposing strategies and reasoned correctly in most of its answers, but it had trouble correctly "seeing" the graphs. The authors say caution and a critical approach are needed if it is used as a tutor for kinematics graphs.
So do not just upload a photo of the graph and trust the reply. Type the graph in as numbers, so the AI is reasoning about the graph you actually have. Our explainer on how multimodal AI reads graphs, and where it fails covers why images are the weak point.
How do you describe a graph to an AI?
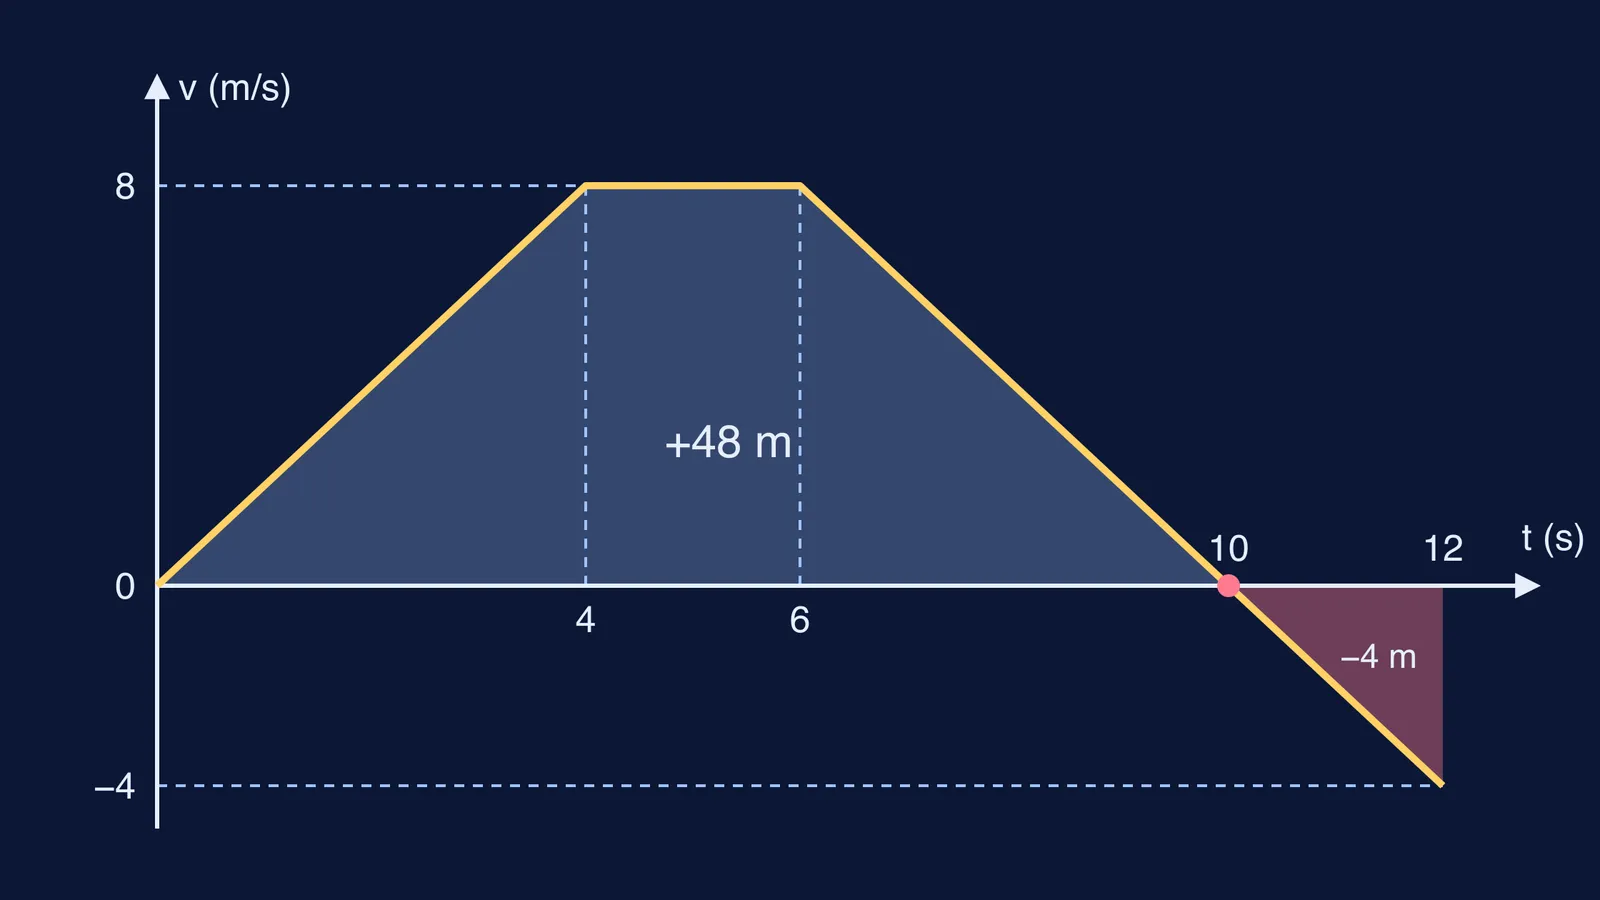
List the corner points of each straight segment, with units. Here is the graph shown at the top of this post:
Velocity-time graph, v in m/s, t in s.
Straight line from (0, 0) to (4, 8).
Flat line from (4, 8) to (6, 8).
Straight line from (6, 8) to (12, -4).
Then paste this prompt:
"Here is a velocity-time graph for an object moving along a straight line. Narrate what the object does second by second from t = 0 to t = 12 s: is it speeding up, slowing down or turning back, and which way is it moving? Do not give me the final displacement. I will work it out myself."
You want the story from the AI and the numbers from you.
What should you check after the AI answers?
Go segment by segment and compare the AI's story with your own numbers.
Slopes. From 0 to 4 s the slope is 8 / 4 = +2 m/s². From 4 to 6 s the slope is 0, so it moves steadily at 8 m/s. From 6 to 12 s the slope is (-4 - 8) / 6 = -2 m/s².
Sign of velocity. Velocity is positive until t = 10 s, so the object moves forward and slows down from 6 to 10 s. After 10 s it moves backward and speeds up.
Areas. 0 to 4 s: ½ × 4 × 8 = 16 m. 4 to 6 s: 2 × 8 = 16 m. 6 to 10 s: ½ × 4 × 8 = 16 m. 10 to 12 s: ½ × 2 × (-4) = -4 m.
Displacement and distance. Displacement is 16 + 16 + 16 - 4 = 44 m. Distance travelled is 48 + 4 = 52 m, since the backward 4 m counts too.
If the AI's story disagrees with any line above, ask it to point to the slope or area behind its claim. For step 4, see why you split the interval when velocity changes sign. For a curved case, try the position-time and velocity-time graphs of a bouncing ball.
How can a tutor help beyond the narration?
Fermi's AI tutor works through a problem with you: it writes on a board, draws the figure, runs the simulation, and checks your understanding as it goes. If an idea is easier to see than to read, the Fermi Simulation Lab has interactive simulations to explore.
Pick one graph from your last test, type out its points tonight, and run the narrate-then-check routine.