

On this page
Textbooks draw the primary and secondary immune response as two humps, a small one and a tall one. You can memorise that shape in a minute and forget it by the exam. It sticks better if you plot it yourself and predict each part before you check it.
What does the antibody graph show after a first exposure?
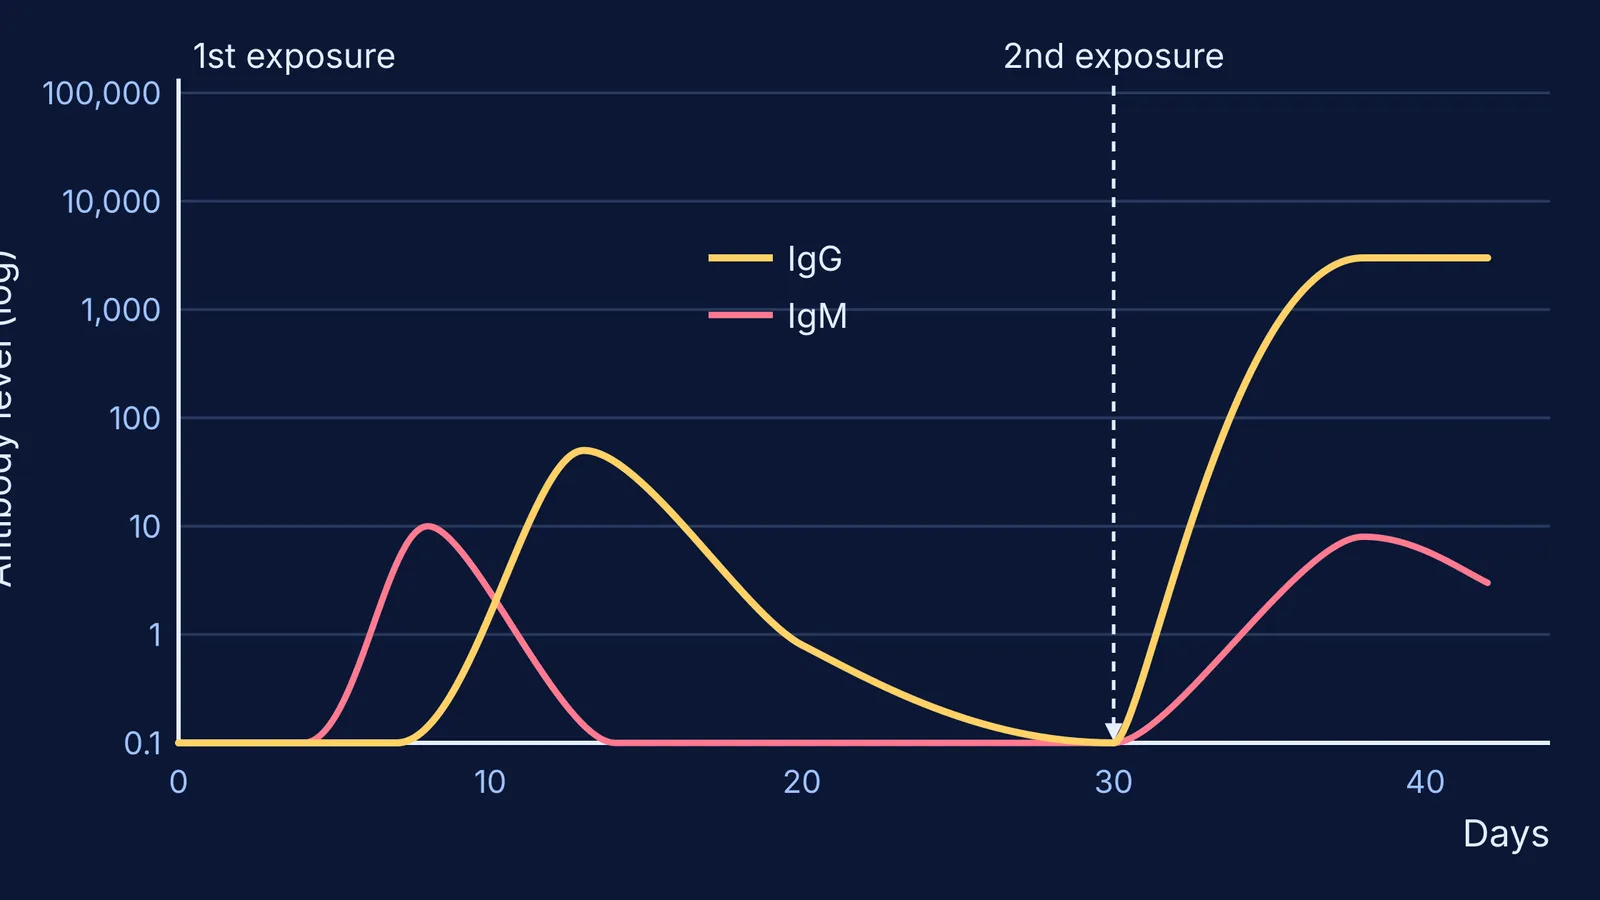
The numbers below come from a model graph in the Open University course COVID-19: Immunology, vaccines and epidemiology. Its vertical axis is a log scale of antibody titre, marked in tenfold steps, and time runs in days.
After the first exposure there is a lag of 4 days before IgM begins to rise.
IgM peaks at 10 units on day 8, then falls to near zero by day 14.
IgG starts rising later, around day 7, and peaks at about 50 units on day 13.
IgG then drops below 1 unit within 20 days of the first exposure.
The lag is the time your immune system needs to find the few B cells that happen to fit this antigen and make enough of them. If you want a refresher on what IgM and IgG are, read our explainer on the structure of IgA, IgM, IgE and IgG.
Why is the second antibody response faster and bigger?
In the same Open University model, the second exposure comes on day 30. This time there is no lag for either antibody class, and IgG reaches several thousand units by day 38, only 8 days later. It is still at that level on day 42. IgM rises to just 8 units, so IgG now dominates.
The course gives clear differences to learn: the lag is shorter, the peak is much higher, IgG predominates and binds the antigen more strongly, and high IgG levels last longer. The reason is memory cells. Some lymphocytes from the first response matured into cells that react faster, to lower levels of antigen, or both, and they sit in lymphoid organs and mucosal tissues, close to where the pathogen will turn up again.
Predict the graph: a five-step plotting exercise
Take a sheet of graph paper or any free graphing tool and redraw the Open University figure. Use days 0 to 42 on the x-axis and a log scale from 0.1 to 100,000 on the y-axis. Before you plot each point, write down your guess. Then compare.
Lag. How many days after the first exposure does anything appear? Plot IgM rising from day 4.
First peak. Which class peaks first, and how high? Plot IgM at 10 on day 8 and IgG at 50 on day 13.
The fall. Plot IgG dropping below 1 by day 20. The memory cells left behind do not show on this graph at all.
Second exposure. Mark day 30. Now predict the lag and the peak before plotting: IgG at several thousand on day 38, IgM at 8.
Compare. Count how many tenfold grid lines separate the two IgG peaks.
If your guesses for step 4 were too low or too slow, good: that gap is what you will remember. For ideas like this, where a curve tells the story better than a paragraph, the Fermi Simulation Lab has interactive simulations for ideas that are easier to see than to read.
How do memory cells explain vaccines and boosters?
A vaccine is a planned first exposure. WHO explains that vaccines contain weakened or inactive parts of an organism that trigger an immune response without causing the disease, and that the primary response leaves memory cells that stay alive after the threat is gone. When the real pathogen arrives, you are already on the second curve.
WHO also notes that some vaccines need several doses weeks or months apart to build long-lived antibodies and memory cells. You can see repeat doses in India's National Immunization Schedule, where a child gets DPT boosters at 16-24 months and 5-6 years, then Td at 10 years and again at 16 years.
How long does protection last? A 2007 study in the New England Journal of Medicine followed antibody levels in 45 people for up to 26 years. Antibodies to measles and mumps had estimated half-lives of more than 200 years, while those to tetanus and diphtheria had half-lives of 11 and 19 years. That faster fall fits with tetanus and diphtheria doses being repeated in the schedule. For your own or your child's vaccine dates, ask a doctor or your local health centre.
To connect this to the bigger picture, read our posts on how memory cells make vaccination work and active vs passive immunity. If immunology terms keep tripping you up, the Fermi Concept Library has a lesson for every biology concept and shows where it sits in the map.
The night before your test, draw both curves from memory: the lag, the two peaks and the switch to IgG.


