

On this page
Equal forward and reverse rates can sound as if nothing is happening. A water-transfer experiment, with glassware or a spreadsheet, shows what is really going on.
What does dynamic equilibrium mean in chemistry?
NCERT's Class 11 chemistry textbook, Unit 6 Equilibrium, describes reactants in a closed vessel whose concentrations fall while product concentrations rise, until neither changes. At that stage, it says, the system is in dynamic equilibrium and the rates of the forward and reverse reactions become equal.
"Equilibrium" means the amounts you can measure stay constant. "Dynamic" means both processes are still running. The chapter adds that equilibrium needs a closed system and can be reached from either direction.
How does the water transfer experiment work?
The same NCERT chapter includes a student activity. You take two 100 mL measuring cylinders, fill the first nearly halfway with coloured water and leave the second empty. Dip a glass tube into cylinder 1, close the top with your finger, and empty the trapped water into cylinder 2, while a second tube moves water from cylinder 2 back to cylinder 1. The tubes are 30 cm long and 3 to 5 mm wide, and they don't have to match.
The levels stop changing while water keeps moving both ways, which is the "dynamic" part. NCERT also points out that with tubes of different diameters, the final levels are different.
A Purdue University demonstration sheet runs the same idea with two aquariums and beakers: an equilibrium is reached whichever beakers are used, but the final levels depend on their sizes. In Chem 13 News in May 2016, Sharon Geyer of Pomfret School described a version with a 50 mL and a 250 mL beaker. Her point: equilibrium arrives when the rates, not the amounts, are equal.
Why do the forward and reverse rates become equal?
If the tube reaches the bottom, each scoop traps a column as tall as the water is deep. With two identical containers, the amount moved depends on the tube's width, which is fixed, and the level it scoops from, which changes. In chemistry terms:
The tube's cross-section is the rate constant, k.
The water level is the concentration.
The amount moved per round is the rate: rate = k × level.
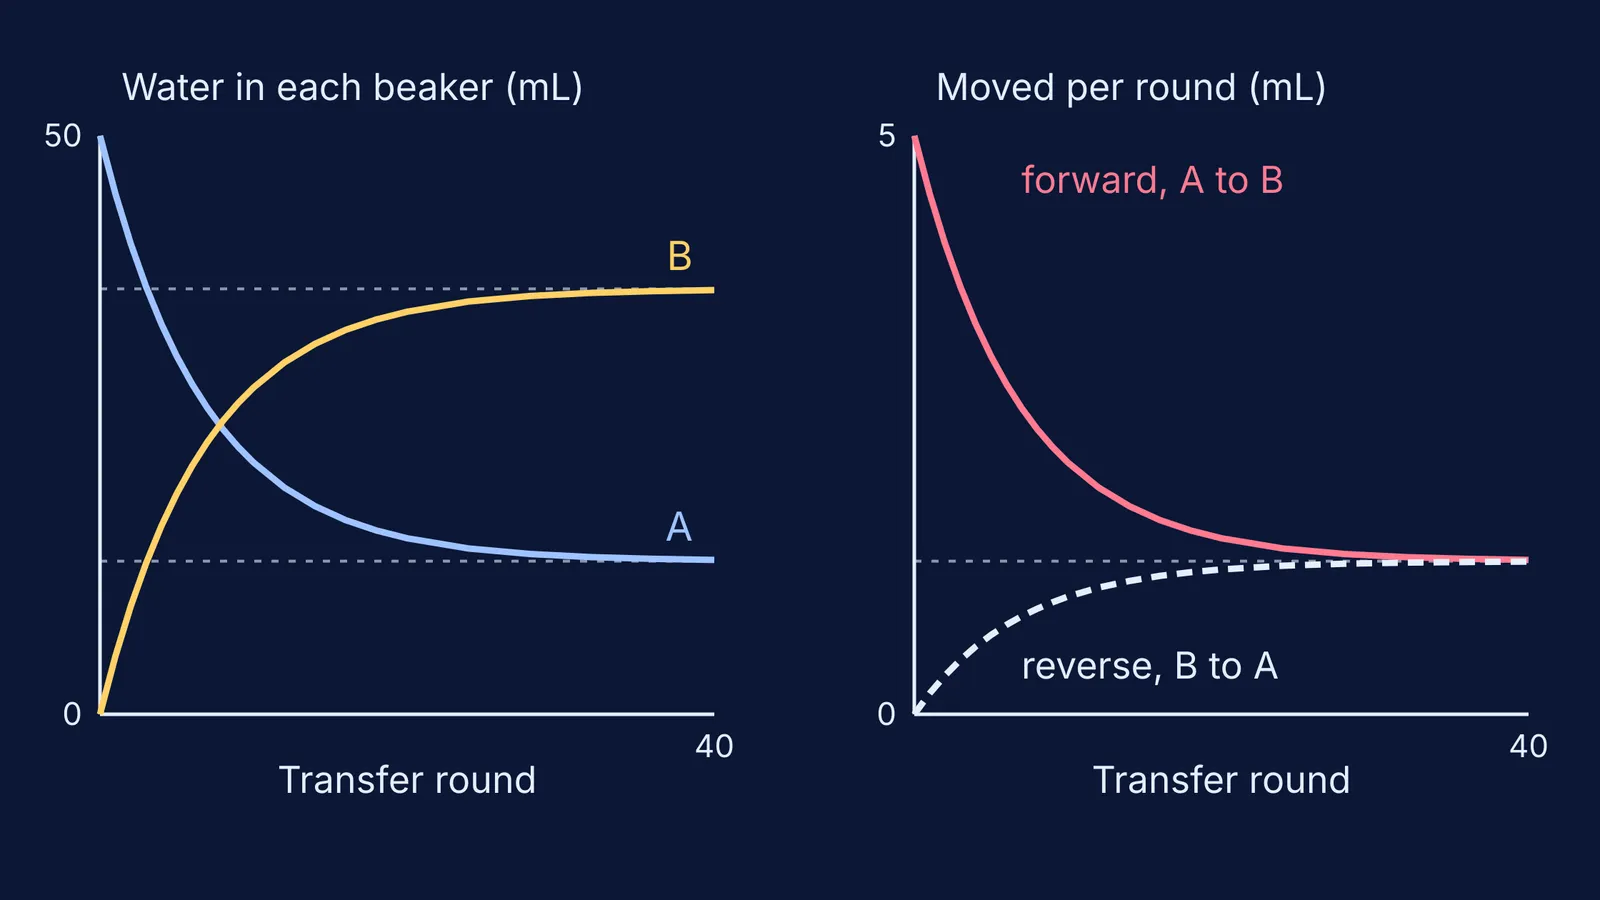
At the start, A is full and B is empty, so the forward rate is large and the reverse rate is zero. Every round, A drops, so the forward rate falls, and B rises, so the reverse rate grows. Once the two rates match, the levels stop changing, and so do the rates.
If you set the rates equal, you get k(forward) × level A = k(reverse) × level B. So level B ÷ level A = k(forward) ÷ k(reverse). That ratio is the equilibrium constant. LibreTexts' chemistry text/Unit_5%3A_Kinetics_and_Equilibria/Chapter_14%3A_Chemical_Equilibrium/Chapter_14.2%3A_The_Equilibrium_Constant) derives this result: K = kf/kr.
Worked example: can you predict the levels before you pour?
Take NCERT's set-up, with two identical containers in place of its 100 mL cylinders: 50 mL in A, B empty, a 5 mm tube for the forward direction and a 3 mm tube for the reverse.
A tube's area grows with the square of its diameter, so k(forward) ÷ k(reverse) = 25 ÷ 9, about 2.78.
At equilibrium, level B ÷ level A = 2.78.
Split the 50 mL in the ratio 9 : 25. A settles at about 13.2 mL and B at about 36.8 mL.
From then on, both tubes move the same amount every round.
Now predict each change before you test it:
Equal tubes: the levels settle equal, at 25 mL each.
Swap the tubes: A ends at 36.8 mL and B at 13.2 mL.
Start with all 50 mL in B: the same final levels, because equilibrium can be reached from either side.
Double the water to 100 mL: both levels double, but their ratio stays 2.78. K doesn't depend on how much you start with.
How do you simulate it in five minutes?
Open a spreadsheet to model the worked example from NCERT's activity. Put 50 in A2 and 0 in B2. In C2 type =0.10*A2 for the forward transfer, and in D2 type =0.036*B2 for the reverse transfer. The numbers keep the 25 : 9 ratio. In row 3, enter =A2-C2+D2 and =B2+C2-D2, then fill all four columns down for 40 rows. By round 10, A holds about 21.8 mL and B about 28.2 mL. By round 40, they sit at about 13.3 and 36.7 mL, close to the predicted levels, and both transfers settle at about 1.3 mL per round. Plot columns C and D and you will see the two rates meet.
For other ideas that are easier to see than to read, Fermi's Simulation Lab has interactive simulations for ideas that are easier to see than to read. The Fermi Concept Library gives each concept in chemistry its own lesson and its place on the map.
Next, see how Q versus K tells you which way a reaction shifts, practise with step-by-step chemical equilibrium problems, or read what virtual chemistry labs can teach.


