On this page
When you see a massive gathering on the news, the reported numbers often vary wildly. Organizers might claim a massive turnout to show popular support, while safety officials and police estimate a fraction of that amount to reflect actual attendance. Instead of guessing, journalists and scientists calculate the total by finding the area and multiplying it by the crowd density.
This technique, known as the Jacobs Method, was developed in the 1960s by Herbert Jacobs, an American journalist and professor at the University of California, Berkeley. During the Free Speech Movement protests, Jacobs observed students from his office tower window. Because the plaza below was paved with concrete blocks that formed a natural grid, he could easily count the people in a few squares and scale it up. By doing this repeatedly, Jacobs established scientific rules of thumb for crowd density (Wikipedia).
How do you estimate crowd size using grid and density?
To use this method accurately, you need a top-down view. This is typically achieved using an aerial photograph taken from a drone, a helicopter, or a high vantage point like a tall building.
Find the total area: First, determine the physical boundaries of the crowd. Measure the square footage or square metres of the space the crowd covers using a mapping tool or satellite imagery.
Apply a grid: Overlay a grid of equal-sized squares on the photograph. This divides the vast space into manageable sections.
Sample the density: Pick a few representative squares across different parts of the crowd and carefully count the people inside them.
Multiply: Find the average number of people per square and multiply it by the total number of squares to get the final estimate.
What are the density rules for the Jacobs Method?
If you cannot count the people in the squares directly from an image, Jacobs defined three standard densities to apply to your total area. These rules provide a reliable baseline for estimating how tightly packed people are (Wikipedia):
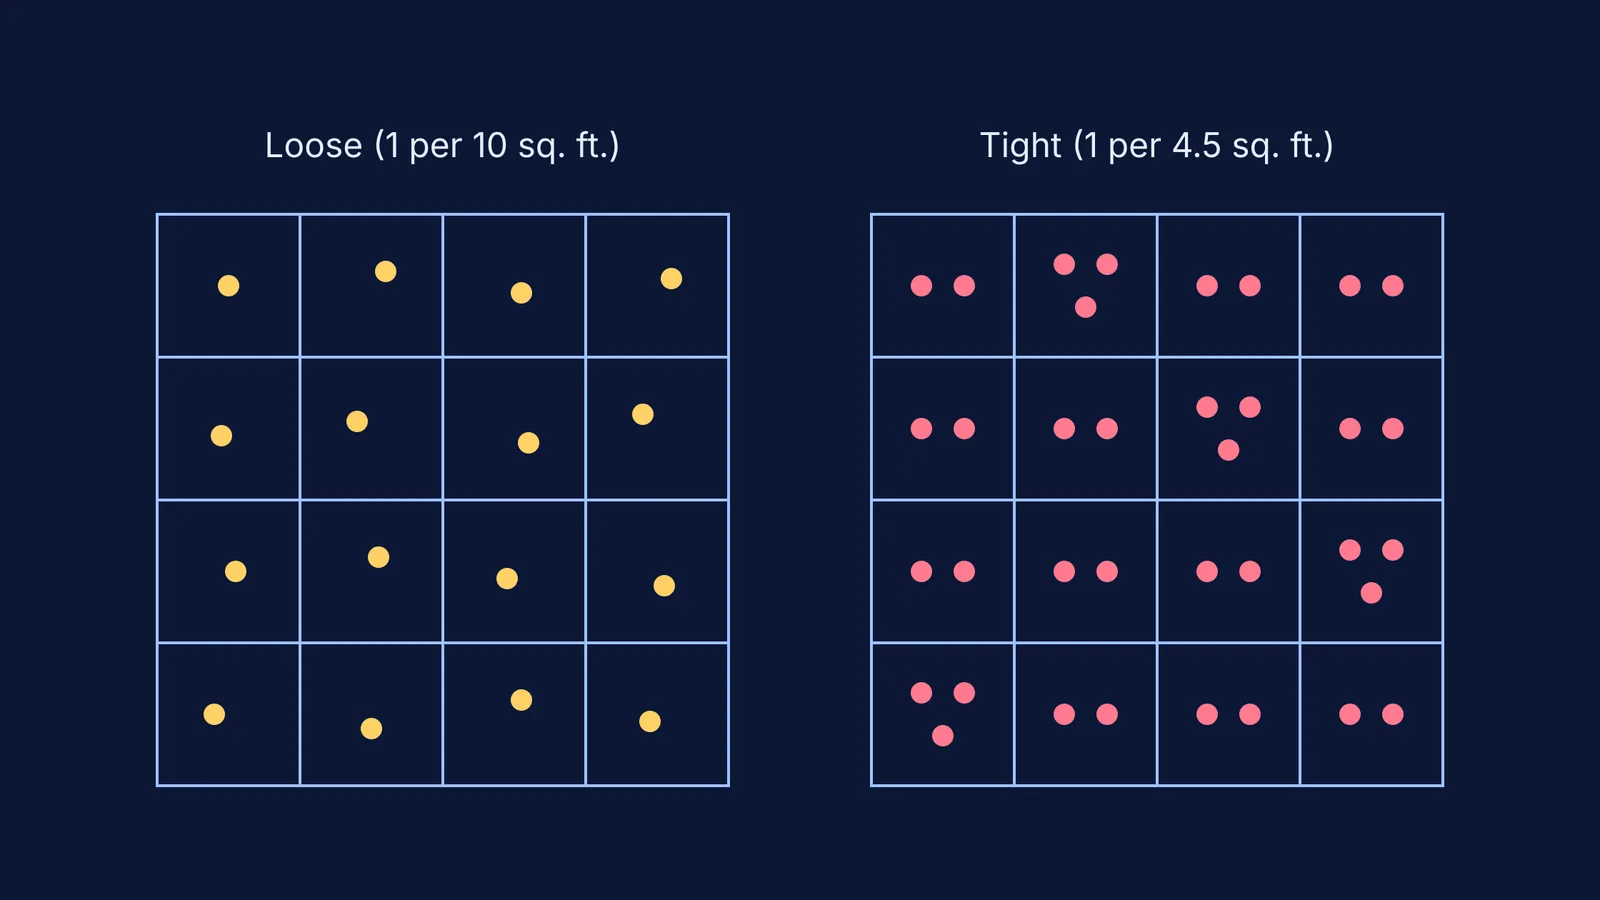
Loose crowd: 1 person per 10 square feet. People are at arm's length from one another and can move freely without brushing shoulders.
Tight crowd: 1 person per 4.5 square feet. People are standing close together but are not actively pushing against each other.
Mosh-pit density: 1 person per 2.5 square feet. This is an extremely dense, dangerous environment with continuous chest-to-back contact. It represents the physical limit of a crowd before trampling occurs.
How do modern analysts count crowds?
Today, the basic grid and density method remains the foundation of crowd estimation. However, since the early 2000s, analysts have shifted from manual counting to using computer algorithms and density maps to handle massive numbers (Wikipedia). Modern deep learning tools, such as Convolutional Neural Networks (CNNs), are explicitly trained to detect human heads in an aerial image. Identifying heads is more reliable than identifying full bodies, which frequently overlap and block each other in dense crowds.
These software models calculate density maps based on the pedestrian's location, the shape of the crowd, and perspective distortion. However, estimating correctly remains challenging in open spaces with visual obstructions like trees, tents, or irregular boundaries. In these cases, the space is divided into discrete zones. The area near a stage might be assigned a mosh-pit density or run through a high-density CNN model, while the edges and rear are calculated as a loose crowd.
How does the Jacobs Method work in practice?
Imagine a hypothetical scenario where you need to estimate the number of people gathering on a large school ground for a public assembly. If the ground measures exactly 50 metres by 40 metres, it gives you a total measurable area of 2,000 square metres. If the crowd is standing closely together to listen to a speaker, you apply the "tight crowd" density from Jacobs' rules (Wikipedia). In metric terms, 1 person per 4.5 square feet is roughly 2.4 people per square metre. Multiplying the 2,000-square-metre area by the density gives an estimated crowd size of roughly 4,800 people.
To teach this concept at home, try estimation games for kids where they guess the number of items in a jar before counting. For older students conducting science projects, understanding these basic statistics and sampling methods is essential for real-world research.
If you are struggling to picture how density and scaling work, the Fermi Simulation Lab provides interactive simulations for the ideas that are easier to see than to read. You can adjust the parameters of a system and see how the total count changes instantly, making abstract mathematical concepts immediately tangible.