On this page
You ask a chatbot for the point that divides a line segment in a given ratio, or for cos θ when sin θ is negative. It replies in neat steps with a confident final answer. The quickest way to know if that answer is right is not to reread the algebra. It is to draw it.
Why do AI chatbots get coordinate geometry wrong?
A text chatbot works with words and symbols; it does not look at a picture of the plane the way you do. Researchers who tested language models on geometric constructions found that they "struggle with 2D spatial relationships and planning, and hallucinate object placements" (Mouselinos, Michalewski and Malinowski, Findings of EMNLP 2024).
A second team warned that a correct final answer can hide a wrong picture. Introducing the GeomRel benchmark, accepted to ICLR 2025, the authors note that models "can arrive at correct answers by coincidence", and their tests found key limitations in how models identify geometric relationships (Wang and colleagues, arXiv 2501.13773).
Drawing is a separate skill again. In a 2026 workshop paper testing models on 954 olympiad geometry problems, the diagram code the models wrote had an average compile success rate of only 36.14% (Peng and colleagues, arXiv 2608.18111). So do the drawing yourself.
We covered the wider pattern in why AI chatbots get maths wrong, and a five-step way to check. Geometry has one advantage: the answer is a place you can look at.
How do you check an AI's coordinate geometry answer by drawing?
Use squared paper at 1 cm per unit, or a free plotter such as GeoGebra or Desmos. Then:
Plot every point the question gives you, and label it.
Before you read the AI's answer, guess roughly where it should be: which quadrant, which side of a line, nearer to which point.
Plot the AI's answer.
Check: right quadrant? On the line or curve it should be on? Right fraction of the way along? Does a perpendicular look like a right angle?
For lengths, measure with a ruler. If the AI says AB is about 6 units but your ruler reads nearly 11 cm, recheck its working.
Worked example: a section-formula answer in the wrong place
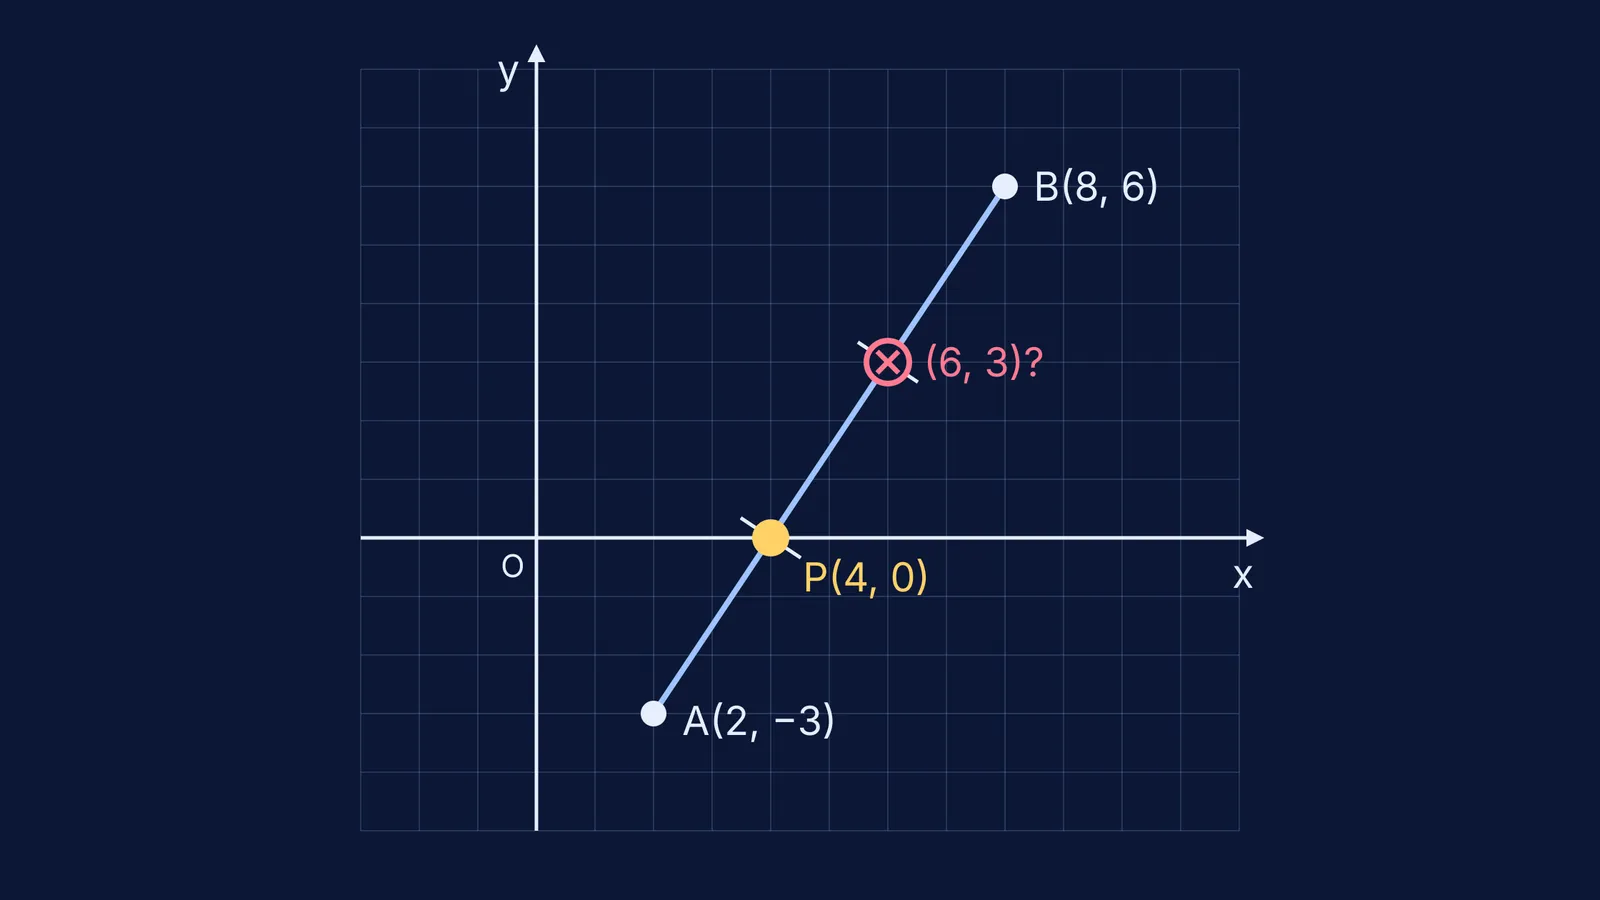
Question: find the point P that divides the segment from A(2, −3) to B(8, 6) internally in the ratio 1 : 2.
Suppose the AI answers (6, 3). Plot A and B and join them. A ratio of 1 : 2 means P is one part from A and two parts from B, so P should sit one-third of the way from A. Mark the thirds along the segment. The point (6, 3) sits at the two-thirds mark, much nearer to B. That is the picture above.
The drawing tells you what went wrong: the ratio was swapped. With m : n = 1 : 2, the section formula gives P = ((1×8 + 2×2)/3, (1×6 + 2×(−3))/3) = (4, 0). Plot (4, 0): it is on the segment, at the one-third mark, right on the x-axis.
What to type back: "Your point (6, 3) is two-thirds of the way from A to B, but a 1 : 2 ratio should put it one-third of the way from A. Please check which ratio number goes with which endpoint."
How do you check the sign of a trigonometry answer with a sketch?
Question: sin θ = −3/5 and θ lies in the third quadrant. Find cos θ and tan θ.
Suppose the AI says cos θ = 4/5 and tan θ = −3/4. Draw axes and a circle of radius 5. In the third quadrant both coordinates are negative, so the point for θ is (−4, −3). Cosine is x divided by the radius, so cos θ = −4/5; tangent is y divided by x, so tan θ = (−3)/(−4) = 3/4. The AI's answer put the point at (4, −3), in the fourth quadrant. One look at the sketch shows the slip.
If the quadrant rules still feel shaky, our guide to trigonometric ratios of allied angles and the ASTC rule walks through them. For ideas that are easier to see than read, the Fermi Simulation Lab has interactive simulations.
What can a drawing not catch?
A sketch catches wrong signs, wrong quadrants, swapped ratios and points that miss a line. It will not tell (4, 0) from (4.2, 0), and in proofs a neat diagram can make a special case look general. When the picture agrees but you still doubt a step, work the method through line by line. The Fermi Problem Library has a step-by-step solver that explains the reasoning rather than printing an answer.
For graphs of functions, the same idea scales up; see using graphing tools to learn functions and calculus, not to skip them. And if you would rather have a tutor that draws the figure with you as it teaches, take a look at Fermi's AI tutor.