On this page
Before the mid-nineteenth century, European death records were legal formalities. Parish clerks logged burials with vague descriptors like "sudden decay," "teeth," or "visitation of God," providing zero usable public health data. Everything shifted when Britain passed the Births and Deaths Registration Act of 1836. In July 1839, physician William Farr became Compiler of Abstracts at the new General Register Office, as documented in the International Journal of Epidemiology. Farr realised that systematic certificates could serve as a national instrument of disease surveillance.
Farr insisted that every certificate record the cause of death alongside age and occupation. To organise this torrent of data, he created a standardized nosology dividing illnesses into epidemic diseases, constitutional disorders, and localized afflictions. Farr's 1853 and 1855 proposals directly shaped the Bertillon Classification of Causes of Death, which the World Health Organization later adopted into the International Classification of Diseases (ICD). For the first time, mortality patterns could be compared across towns, occupations, and seasons.
How did Farr's data help John Snow prove waterborne cholera?
During London's cholera outbreaks in the 1840s and 1850s, medical consensus attributed infection to "miasma"—poisonous airborne vapours from rotting filth. Farr initially supported this view, formulating his "elevation law" to show that cholera mortality fell as altitude above the Thames increased, as documented in the International Journal of Epidemiology. Yet physician John Snow argued that cholera was waterborne. Rather than defending dogma, Farr instructed registrars to record the water supplier for every household suffering a cholera fatality.
This meticulous recording enabled Snow's 1854 investigation. In South London, two competing suppliers piped water down the same streets. Lambeth drew clean water upstream of London, while Southwark and Vauxhall drew from Battersea, downstream of sewer outfalls. Official returns published in Snow's 1855 treatise showed that Southwark and Vauxhall supplied 40,046 houses where 1,263 cholera deaths occurred (315.4 deaths per 10,000 houses). In contrast, Lambeth supplied 26,107 houses recording 98 deaths (37.5 deaths per 10,000 houses), while the rest of London averaged 59 deaths per 10,000 houses across 256,423 homes. Customers drinking sewage-polluted water died at 8.4 times the rate of neighbors on the same streets.
Farr followed the empirical evidence. Seeing identical elevations produce vastly different death counts based on water supply, he abandoned the miasma hypothesis. By 1866, Farr used his surveillance machinery to trace cholera to sewage leaks in East London reservoirs. This sanitary revolution connected directly with later advances, including Leonard Rogers and the stronger saline that cut cholera deaths and water-testing by Ellen Swallow Richards and the chlorine map of clean water, as explored in the International Journal of Epidemiology.
What was Farr's Law of Epidemics?
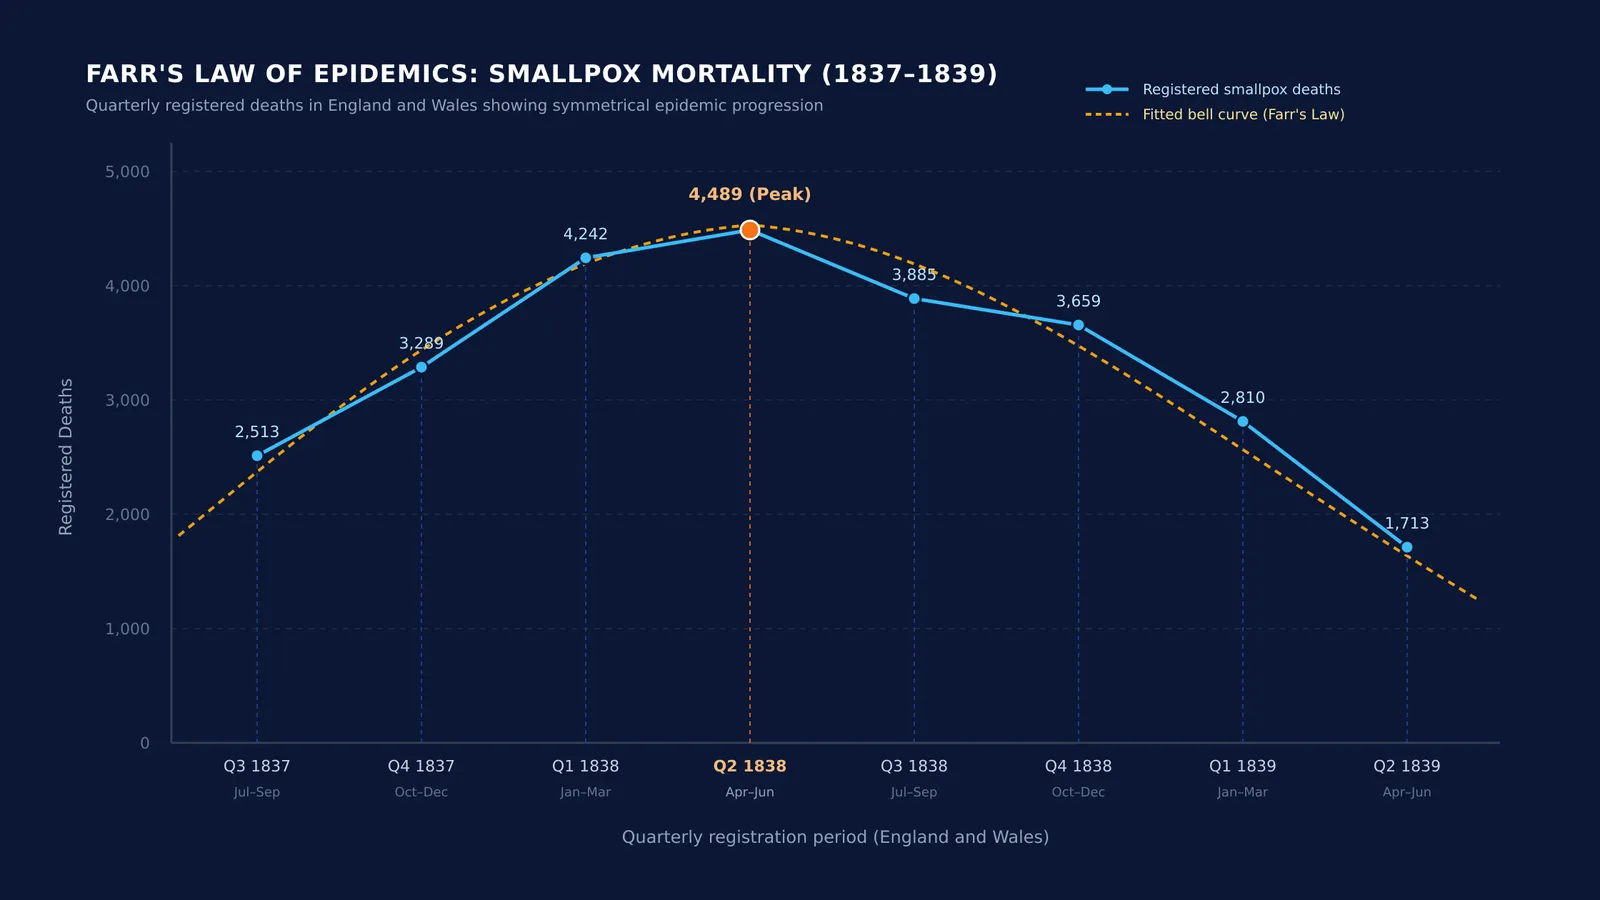
Farr also searched for mathematical principles governing disease spread. Analysing the 1837–1839 smallpox epidemic in England and Wales for the Registrar-General's Second Annual Report, Farr noticed that quarterly deaths followed a smooth bell curve over time, as highlighted in the International Journal of Epidemiology. Smallpox mortality began at 2,513 deaths in the third quarter of 1837, rose through 3,289 and 4,242, peaked at 4,489 deaths in the second quarter of 1838, and declined through 3,885, 3,659, and 2,810 to 1,713 deaths by mid-1839.
This observation formed Farr's Law of Epidemics: outbreaks rise, peak, and fall along a symmetrical curve, with the deceleration mirroring earlier acceleration. Farr proved that an epidemic subsides long before every susceptible individual is infected. This insight mirrored the statistical regularities studied by contemporaries like Adolphe Quetelet and the body mass index, giving public health officers their first empirical tool to forecast when an active outbreak would subside, as recorded in the International Journal of Epidemiology.
Worked example: how do you calculate disease risk from mortality data?
To see how Farr and Snow used data to expose disease sources, work through the calculation comparing the Southwark and Vauxhall company with Lambeth from the Bulletin of the World Health Organization:
Identify counts: Southwark and Vauxhall had 1,263 deaths across 40,046 houses; Lambeth had 98 deaths across 26,107 houses.
Standardise rates per 10,000 houses:
Rate (Southwark and Vauxhall) = (1,263 ÷ 40,046) × 10,000 = 315.4.
Rate (Lambeth) = (98 ÷ 26,107) × 10,000 = 37.5.
Compute relative risk: Rate Ratio = 315.4 ÷ 37.5 ≈ 8.41.
Calculate attributable risk: 315.4 − 37.5 = 277.9 excess deaths per 10,000 houses.
The rate ratio reveals that households drinking sewage-polluted water faced more than eight times the risk of dying from cholera compared to neighbors drinking upstream water, as verified in the Bulletin of the World Health Organization.
How can you apply systematic error tracking to exam preparation?
Farr's insight carries a valuable lesson for students. When test results fall short, students often label an entire attempt a failure without diagnosing specific causes. Just as medicine improved once physicians categorized causes of death, your scores improve when you log errors by type:
Concept misunderstanding: failing to grasp the underlying physical or chemical law.
Calculation slips: arithmetic errors, inverted signs, or misplaced units.
Strategy errors: selecting the wrong equation for the problem's boundary conditions.
When wrong-method mistakes dominate your problem sets, the Fermi Problem Library provides worked problems with a step-by-step solver that explains the reasoning rather than printing an answer. If your error log shows conceptual gaps in organ physiology or reaction kinetics, the Fermi Concept Library covers every concept in physics, chemistry, biology, mathematics and computing, each with its own lesson and its place in the map. When you sit down to study and need direction, Fermi's AI tutor works out what you already know and builds a plan for the session, turning raw mistakes into steady progress.