On this page
Hipparchus never knew that the Earth wobbles. He found its effect in star positions that someone else had written down long before him, which shows what careful old data can reveal that one lifetime of watching cannot.
What did Hipparchus actually compare?
Hipparchus was born in Nicaea (today İznik in Türkiye) around 190 BC and probably died on Rhodes, according to the MacTutor biography from the University of St Andrews. His books on precession are lost. We know about them because Ptolemy describes them in the Almagest, including two titles, *On the Displacement of the Solstitial and Equinoctial Points* and *On the Length of the Year* (Hipparchus, Wikipedia).
According to Ptolemy, Hipparchus measured the longitudes of bright stars such as Spica and Regulus and compared them with earlier records by Timocharis and Aristillus (Hipparchus, Wikipedia). Here, longitude means a star's position along the Sun's yearly path, counted from an equinox point. Timocharis made his observations about 150 years before Hipparchus (Encyclopedia.com on precession).
The result: Spica sat about 6° west of the autumnal equinox and had shifted about 2° relative to it since Timocharis's day (Axial precession, Wikipedia). Hipparchus's explanation was that the stars had not moved relative to each other. What had moved was the zero point they were measured from: the equinox.
How do you get a rate from two old measurements?
Ptolemy reports that Hipparchus put the rate at not less than 1° per century (Axial precession, Wikipedia).
Shift: about 2°, which is 2 × 3,600 = 7,200 arcseconds.
Time between the two sets of observations: about 150 years.
Rate: 7,200 ÷ 150 = 48 arcseconds a year.
Hipparchus's cautious floor of 1° per century works out to 3,600 ÷ 100 = 36 arcseconds a year.
The modern rate of precession is about 50.3 arcseconds per year (Axial precession, Wikipedia). MacTutor gives Hipparchus's value as 46″ a year, compared with a modern 50.26″, and says it is much better than the 36″ Ptolemy obtained nearly 300 years later.
Now run it backwards. A full circle is 360 × 3,600 = 1,296,000 arcseconds, and 1,296,000 ÷ 50.3 ≈ 25,800 years. NASA puts the period of precession at about 26,000 years.
A 2° shift is small, and ancient instruments could be off by a fraction of a degree. Stating a minimum ("not less than") was the honest choice.
Why do the equinoxes drift at all?
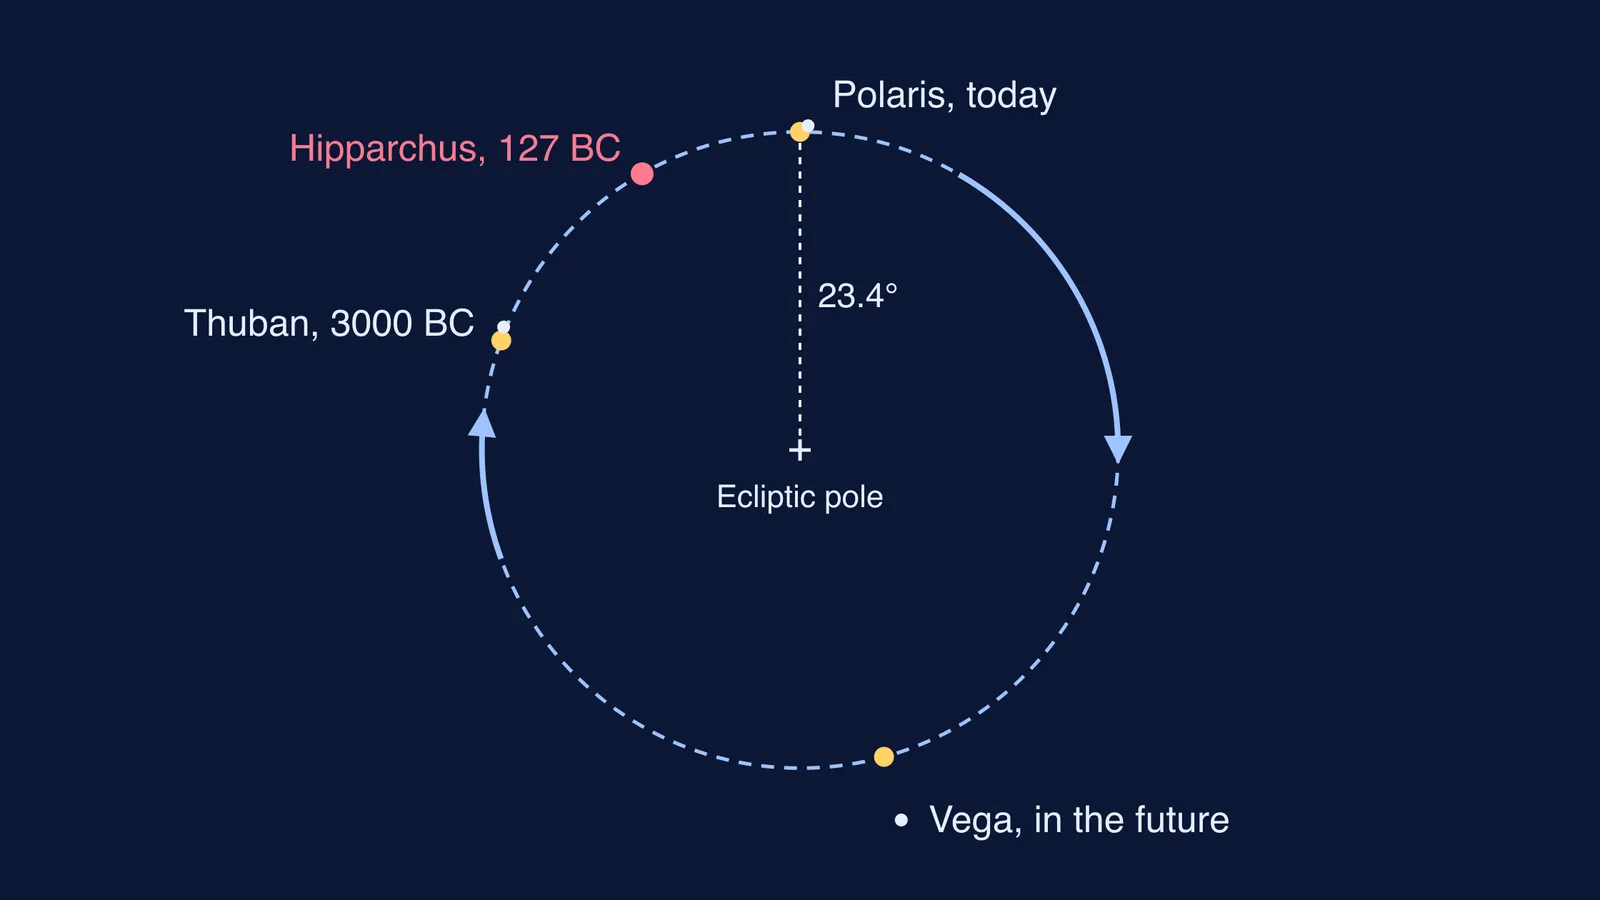
Earth is not a perfect sphere. It bulges at the equator, and the gravitational pull of the Moon and the Sun on that bulge makes Earth's spin axis trace out a cone, NASA explains (NASA StarChild). The equinoxes are where the celestial equator crosses the Sun's path. When the axis swings, those crossing points slide along the zodiac.
Hipparchus described the effect, not the cause. The physics behind it is the same idea as a spinning top that leans but does not fall, which we explain in why a spinning wheel does not fall: gyroscopic precession.
The same wobble changes the pole star. NASA notes that around 3000 BC the North Star was Thuban, and that in about 13,000 years Vega will take that role (NASA StarChild).
Where can you see precession in India today?
Makar Sankranti now falls on 14 or 15 January, while the winter solstice comes on 21 or 22 December, and Drik Panchang attributes the gap to precession. Sankranti follows the Sun against the stars; the solstice follows the seasons.
You can check this with Hipparchus-style arithmetic:
The Sun moves 360° in about 365 days, so roughly 1° a day.
A gap of about 24 days is therefore about 24° of drift, or 86,400 arcseconds.
At 50.3 arcseconds a year, that takes 86,400 ÷ 50.3 ≈ 1,700 years.
So, roughly 1,700 years ago, the two fell close together.
How can you use Hipparchus's method on your own data?
Next time two measurements disagree:
Compare like with like. Same quantity, same definition, same reference point.
Ask what moved. If one value changed, look at that item. If everything shifted the same way, suspect the reference.
Turn a difference into a rate. Convert units first (degrees to arcseconds), then divide by the time between measurements.
Report a floor when the data is rough. "At least" is a real result.
Sanity-check against a known value. Does your answer land near the accepted figure, or is it off by a factor of ten?
A student example: if your marks drop by a similar amount in physics, chemistry and maths in the same mock test, check the paper's difficulty before you decide you have forgotten everything.
If a cone-shaped wobble is hard to picture from a flat textbook figure, the Fermi Simulation Lab has interactive simulations for ideas that are easier to see than to read. To revise the angles and arcseconds underneath, the Fermi Concept Library gives every concept in physics and mathematics its own lesson.
For what happened to Hipparchus's work next, read about his lost star catalogue and chord tables and Ptolemy's Almagest, which preserved it.