On this page
Most people know Gustave Eiffel for the iron tower he finished in Paris in 1889. Fewer know that he turned it into a physics instrument. A history of his research in The Aeronautical Journal (Black, 1990) describes how, from 1903, when he was in his seventies, until his death in 1923, Eiffel pioneered much of the experimental research that the designers of the first aeroplanes needed. His question was simple: how hard does air push back on something moving through it?
How did Eiffel use his tower to measure air resistance?
A dropped object speeds up until air resistance balances its weight, then falls at a steady speed. According to the ASME brochure that named Eiffel's apparatus a historic engineering landmark, he built a machine that drew the drag on a paper graph as it fell, so he could study the trace afterwards.
A vertical guide wire ran from the tower's second floor to the ground, about 115 metres (377 feet).
The test shape was fixed to a rod sticking out of the bottom of the machine, attached to a spring force gauge inside.
The trace rose as the machine sped up, then levelled off once its speed was constant.
A brake about 21 metres above the ground stopped the fall safely.
The ASME brochure records the first drop on 30 July 1903 and some 40 different shapes tested over the next three years. Eiffel published the results in 1907 as *Recherches expérimentales sur la résistance de l'air exécutées à la Tour Eiffel*. An account of the falling apparatus that quotes Eiffel's own description gives speeds of up to 40 metres per second.
What did Eiffel discover about drag?
In his 1910 book *La résistance de l'air et l'aviation*, Eiffel wrote that the tower drops showed clearly that air resistance can be written as R = KSV². Here S is the area facing the air, V is the speed, and K is a coefficient that depends on the shape of the body, rises slightly with its area, and does not depend on speed. For square plates of about 1 square metre, he put K nearer 0.08.
The account of the tower experiments gives an average K of 0.070 from the tower drops (with R in kilograms-force, S in square metres and V in metres per second). It says engineers had generally used about 0.12, so Eiffel's figure cut the expected wind pressure to about 57% of the accepted value.
Why did Eiffel build a wind tunnel?
The drop machine could not study wing lift or propellers. The ASME brochure explains that a wind tunnel assumes the force on a still object in moving air equals the force on that object moving through still air. Nobody had tested it.
Eiffel's first tunnel, finished in 1909 at the Champ-de-Mars near the tower, drew power from the tower's own generator. A blower driven by a 50-kilowatt motor drew a column of air 1.5 metres across through a closed test room at 20 metres per second. One of his first test series reran the shapes from the tower drops, and the forces matched. Between 1909 and 1912 he ran over 4,000 tests, many on wings and propellers brought by aviation pioneers.
In 1912 he moved to a larger laboratory at Auteuil, with a 1-metre tunnel reaching 40 metres per second and a 2-metre tunnel reaching 32 metres per second. His pressure measurements also showed that more of a wing's lift comes from lower pressure above it than from higher pressure below. For the wider story, read about George Cayley and the idea of lift, drag and thrust and the Wright brothers' first flight, worked out in numbers.
How hard does wind push on a flat plate?
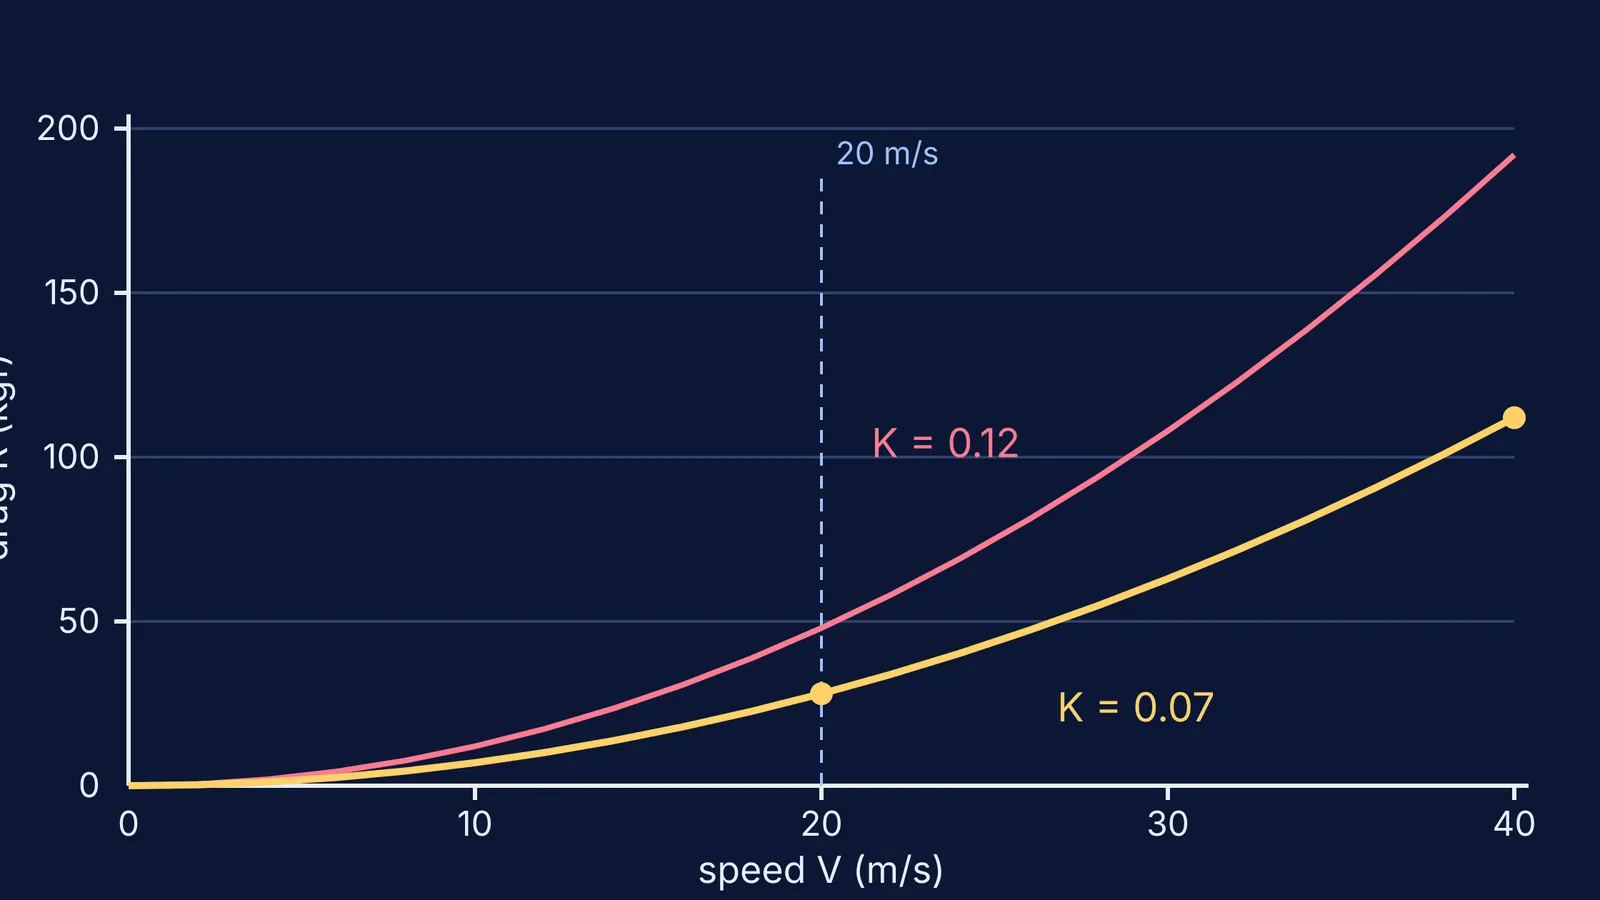
Take his tower average, K = 0.07, a 1 square metre plate facing the wind, and the 20 m/s of his first tunnel.
At 20 m/s: R = 0.07 × 1 × 20² = 28 kgf, about 275 N.
At 40 m/s: R = 0.07 × 1 × 40² = 112 kgf. Twice the speed, four times the force.
With the older coefficient of 0.12 at 20 m/s: R = 48 kgf, about 70% more than Eiffel's value.
Now convert to the modern form. The NASA drag equation is D = Cd × ρV²A/2. Sea-level air has a density of about 1.229 kg/m³, according to NASA's properties of air. Since 1 kgf is about 9.81 N, Cd = 2 × 0.07 × 9.81 ÷ 1.229, or about 1.1. With his 1910 value of about 0.08 for a 1 square metre plate, the same sum gives about 1.28, the flat-plate value in NASA's table of shape effects.
For tiny drops, drag grows with V instead, as George Stokes showed for drops falling slowly through air.
If the curve is hard to picture, the Fermi Simulation Lab has interactive simulations for ideas that are easier to see than read. For practice, the Fermi Problem Library has worked problems with a step-by-step solver that explains the reasoning rather than printing an answer.