On this page
When transmission electron microscopes emerged after Ernst Ruska's development of the first electron microscope, biologists gained the ability to inspect cellular details below the wavelength of visible light. Yet biological specimens presented a fundamental obstacle: an electron micrograph is not a relief photograph, but a two-dimensional projection of a three-dimensional object.
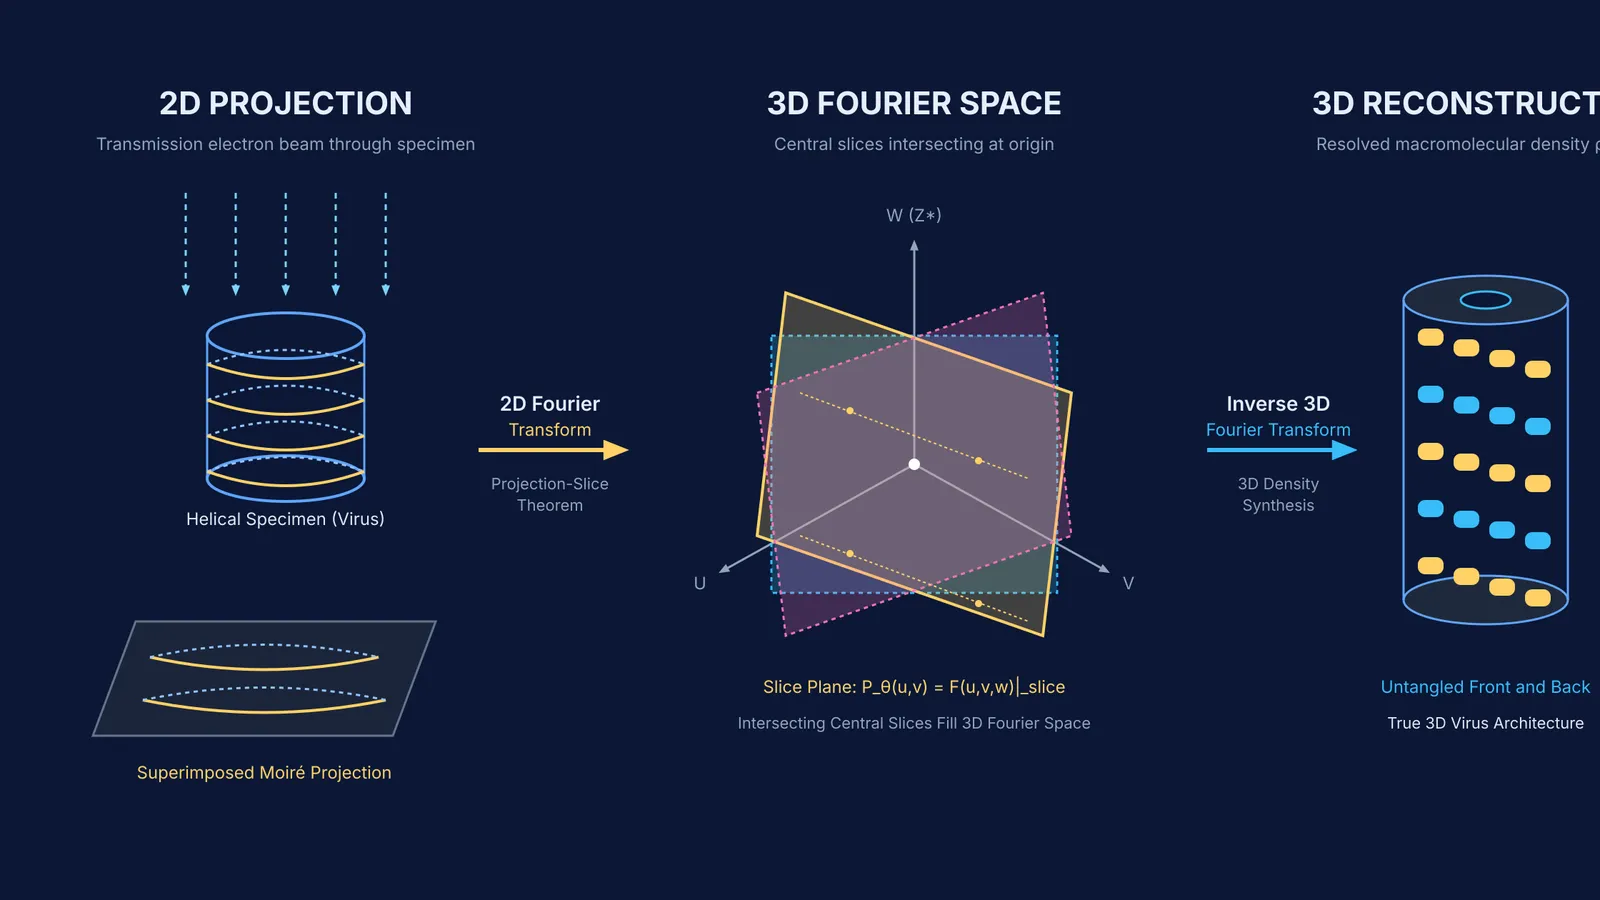
Because electron microscope depth of focus exceeds specimen thickness, the beam records the top, interior, and bottom simultaneously. In his 1982 Nobel lecture, Aaron Klug compared this to a chest X-ray, where front and back ribs appear superimposed. For cylindrical viruses, this overlap created confusing moiré patterns that prevented researchers from untangling the front surface from the back.
Why were two-dimensional micrographs not enough?
In standard light microscopy, adjusting focus isolates one optical plane while blurring regions above and below it. Transmission electron microscopy instead keeps the entire specimen in focus at once. Dense stains like uranyl acetate coat both upper and lower surfaces, scattering electrons from all depths onto one photographic plate.
When imaging a helical virus, subunits on the front ascend in one direction while those on the back ascend in the opposite direction. The photographic plate superimposes both lattices into an optical moiré pattern. Without a physical way to separate them, researchers could not determine whether an observed protrusion belonged to the viral surface or the inner core.
How does crystallographic electron microscopy work?
In 1964, Aaron Klug and J. E. Berger introduced an optical method to separate these overlapping surfaces (Klug & Berger, 196480081-4)). Shining laser light through a micrograph inside an optical diffractometer caused repeating subunits to act as a diffraction grating, sorting the image into spatial frequencies.
Because a helix presents opposite handedness on its front and rear faces, the two surfaces produce reflections on opposite sides of the meridian. By inserting an opaque mask with small apertures in the focal plane to block one side of the pattern, Klug reconstructed a filtered image showing only the front or rear surface alone.
In 1968, David DeRosier and Aaron Klug turned this physical insight into a complete mathematical framework for 3D reconstruction (DeRosier & Klug, 1968). Their work established the projection-slice theorem: the 2D Fourier transform of a projection is mathematically identical to a central slice through the object's 3D Fourier transform.
The Fermi Simulation Lab provides interactive simulations for ideas that are easier to see than to read, letting you observe how wave interference and Fourier components construct complex spatial patterns.
How did Aaron Klug reconstruct virus structures in 3D?
Klug began studying virus architecture at Birkbeck College in 1954 alongside Rosalind Franklin. Using X-ray diffraction, Franklin proved that the tobacco mosaic virus (TMV) is a hollow cylinder 3000 Å in length with helical subunits (Franklin, 1955). After Franklin died in 1958, Klug carried their research forward at Cambridge.
Combining Franklin's findings with Donald Caspar's theory of quasi-equivalence in virus capsids (Caspar & Klug, 1962), Klug recognized that symmetry accelerates 3D reconstruction. Because a helical filament like the bacteriophage T4 tail repeats identical subunits along its axis at regular rotational steps, a single micrograph contains multiple independent viewing angles. DeRosier and Klug used this symmetry in 1968 to calculate the first quantitative 3D biological reconstruction from electron micrographs.
As detailed in the 1982 Nobel Prize in Chemistry announcement, Klug proved TMV consists of RNA encased in 2,130 identical protein molecules, revealing how it self-assembles through intermediate disk rings.
What did Klug discover about chromatin and nucleosomes?
During the 1970s at the MRC Laboratory of Molecular Biology, Klug turned these methods toward understanding how human cells pack two metres of DNA into a microscopic nucleus (Finch & Klug, 1976).
Working with Roger Kornberg, John Finch, and Daniela Rhodes, Klug's laboratory crystallized and solved the nucleosome core particle. Their 1977 Nature study showed a disk measuring 11 nm across and 5.7 nm high, where approximately 140 base pairs of DNA wrap in 1.75 turns around a histone octamer (Finch et al., 1977), later refined to 146 base pairs. Finch and Klug also formulated the solenoidal model of 30-nanometre fibres (Finch & Klug, 1976), as explored in our guide to DNA packaging into nucleosomes and chromatin fibres.
Just as Lawrence Bragg's discovery of X-ray diffraction in crystals opened crystalline lattices, Klug's crystallographic electron microscopy enabled 3D mapping of flexible macromolecular assemblies.
How do you apply the Crowther criterion in virus imaging?
In 1970, R. A. Crowther, D. J. DeRosier, and Aaron Klug formulated a mathematical rule determining the data required for 3D reconstruction (Crowther, DeRosier & Klug, 1970). The Crowther criterion specifies the minimum number of projection views N over a 180° tilt range to achieve spatial resolution d for a specimen of diameter D:
N = (π × D) / d
Here is how to apply the formula to an imaging run:
Identify specimen size and resolution: Suppose you image a spherical virus of diameter D = 80 nm and require resolution d = 2.0 nm.
Apply the formula: N = (π × 80 nm) / 2.0 nm = 40π ≈ 125.7 views. Rounding up, an asymmetric particle needs 126 projections across 180° (an angular step Δθ ≈ 1.43°).
Account for symmetry: With icosahedral symmetry (60 equivalent units), each exposure yields 60 related views. The required physical micrographs drop to: N_sym ≈ 126 / 60 ≈ 2 to 3 views.
The Fermi Problem Library offers worked problems with a step-by-step solver that explains the reasoning rather than printing an answer.