
On this page
Long-distance shortwave radio depends on an electrically charged region of the upper atmosphere, and a strong solar flare can cut it off. Ashesh Prosad Mitra, a physicist at the National Physical Laboratory (NPL) in New Delhi, spent much of his career studying how that happens. Later he turned the same careful measurement on India's air pollution and greenhouse gases.
Who was A. P. Mitra?
Mitra lived from 21 February 1927 to 3 September 2007, according to his Royal Society biographical memoir by K. K. Mahajan. He was born in Kolkata, studied at the University of Calcutta, directed NPL from 1982 to 1986, and then served as Director General of the Council of Scientific and Industrial Research (CSIR) from 1986 to 1991 (career summary). He won the Shanti Swarup Bhatnagar Prize in 1968 and was elected a Fellow of the Royal Society in 1988 (same source). The memoir adds that he became president of the International Union of Radio Science.
What did A. P. Mitra discover about the ionosphere?
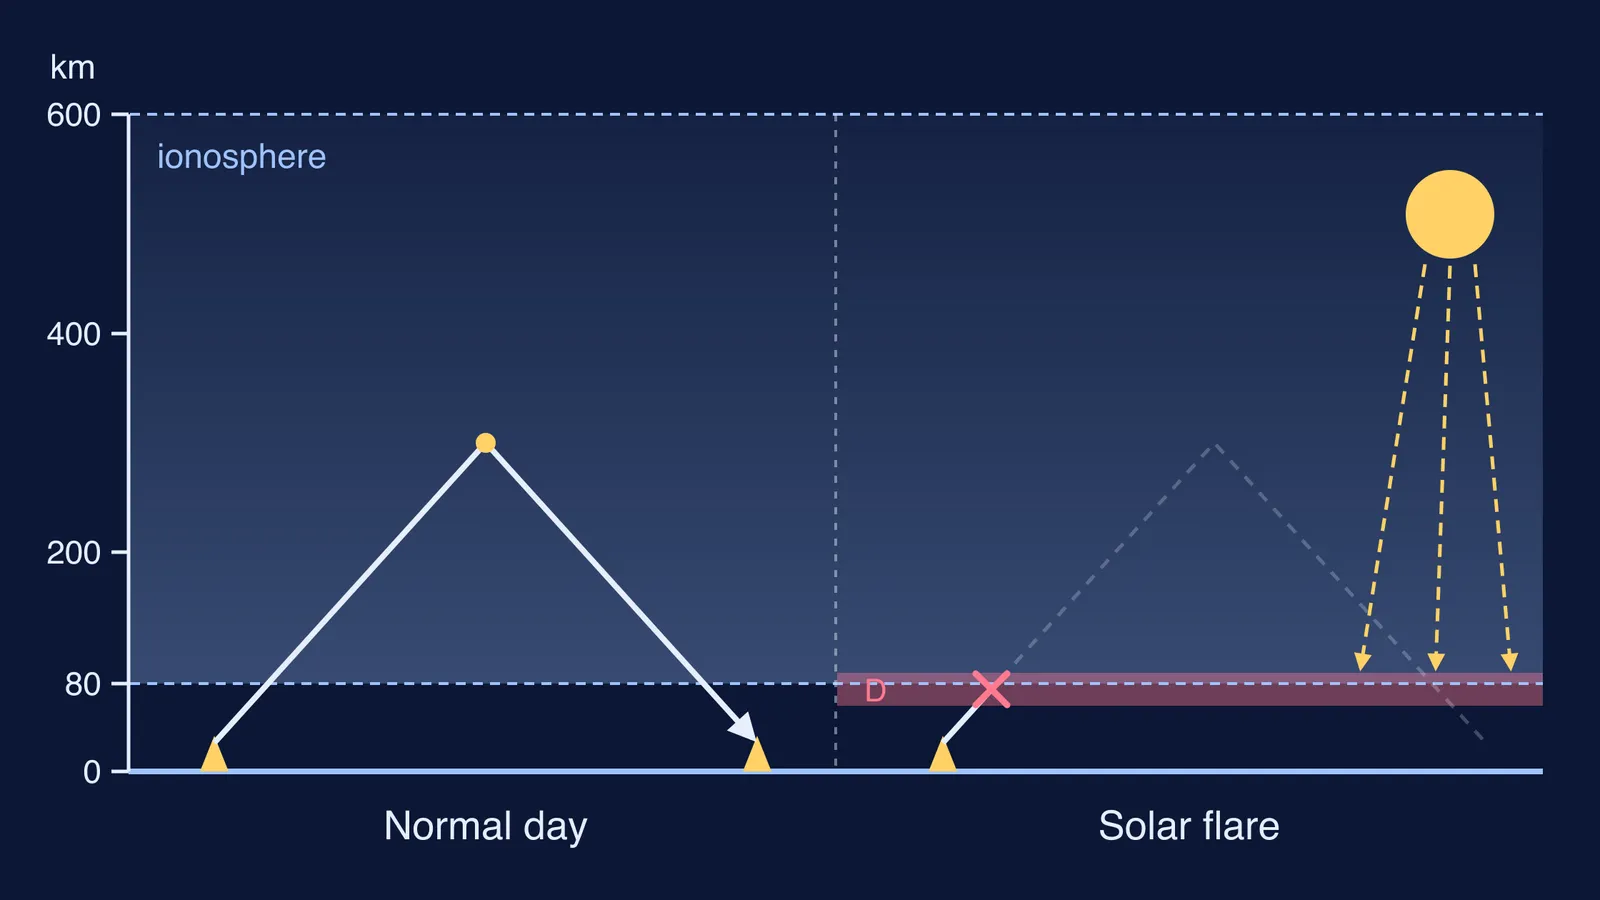
The ionosphere is the part of Earth's upper atmosphere, between 80 and about 600 km up, where extreme ultraviolet and X-ray light from the Sun ionises atoms and molecules (NOAA Space Weather Prediction Center).
When a strong flare erupts, extra ionisation in the lower, denser layer, the D-layer, makes radio waves lose energy in collisions, and signals in the 3 to 30 MHz band can be degraded or completely absorbed (NOAA on radio blackouts).
That D-region was Mitra's territory. His memoir says he devised methods for studying how solar flares change the electron density of the atmosphere's layers, particularly the D-region, and that he set up India's national programme for monitoring these disturbances (Mahajan, 2024). In 1974 he collected this work in a book, Ionospheric Effects of Solar Flares.
One of his main tools was a signal that was already there. Radio noise from space reaches the ground all the time, so if the sky above suddenly absorbs more, less of that noise arrives. His work on cosmic radio noise for studying the upper atmosphere led to a series of discoveries in ionospheric physics, solar physics and cosmic rays, and he developed an ionospheric prediction system that supported broadcasting (Down To Earth, 2007).
How did he move from radio waves to air pollution and climate?
His interests widened from the upper atmosphere to the air closer to the ground. His memoir describes interests that grew to cover atmospheric chemistry, the ozone hole and global warming caused by industrial activity (Mahajan, 2024). Its list of his writing includes an NPL report, Human Influences on Atmospheric Environment (1982), a CSIR report on greenhouse gas emission in India (1992), and a 1994 Current Science paper on the methane budget from Indian paddy fields.
That methane work mattered. A US Environmental Protection Agency report had put methane from Indian rice fields at 38.6 million tonnes a year, while Mitra showed India emitted four million tonnes of methane a year (Down To Earth, 2007).
He also took part in the Indian Ocean Experiment (INDOEX), an international field campaign in January to March 1999 that tracked air pollution from South and Southeast Asia over the Indian Ocean. The team, with Mitra among the authors, found surprisingly high pollution over the entire northern Indian Ocean, reaching to about 6°S, and showed that biofuel use and agricultural burning raised carbon monoxide levels (Lelieveld et al., Science, 2001).
How can you think like Mitra in your own physics?
You can try two of his moves with Class 11 and 12 physics.
Worked example 1: which waves does a flare black out? NOAA names the 3 to 30 MHz band (NOAA). Use λ = c/f with c = 3 × 10^8 m/s.
At 3 MHz: λ = (3 × 10^8) ÷ (3 × 10^6) = 100 m.
At 30 MHz: λ = (3 × 10^8) ÷ (3 × 10^7) = 10 m.
So a flare-time blackout hits radio waves 10 to 100 m long. NOAA calls these high-frequency (HF) radio signals, even though the waves are metres long.
Worked example 2: how far apart were the methane numbers? Divide 38.6 by 4 to get about 9.7 (Down To Earth). When two estimates differ by about ten times, don't just pick a side. Ask which assumption differs: the area, the rate per hectare, or how long the emission lasts.
Three of his habits you can borrow:
Use a signal you already have. Cosmic noise was arriving anyway; your own mock-test errors are free data too.
Check big numbers against a measurement close to the problem.
Follow a question across subjects, as he did from radio physics to chemistry to climate.
If λ = c/f or ionisation still feels shaky, the Fermi Concept Library has a lesson for every concept in physics, chemistry, biology, mathematics and computing. If you don't know where to start with a topic like this, Fermi's AI tutor can work out what you already know and build a plan for the session.
Next time a solar flare makes the news, work out which radio wavelengths it would have silenced.