
On this page
Look at any good photo of Jupiter and you will see a reddish oval below the planet's equator. That oval is a storm, and it has been getting smaller. Here is what it is and what it teaches you about pressure and wind on any planet.
What is the Great Red Spot on Jupiter?
NASA's Jupiter facts page describes the Great Red Spot as "a giant storm bigger than Earth". Jupiter's stripes are cold, windy clouds of ammonia and water floating in an atmosphere made mostly of hydrogen and helium, and strong east-west winds blow in opposite directions on either side of each stripe.
The storm sits between two of those jet streams. According to NASA Goddard, the Great Red Spot is an anticyclone swirling around a centre of high atmospheric pressure, so it turns the opposite way to a hurricane on Earth. NASA also notes that nobody is sure yet what makes it red.
At its outer edge, winds reach about 450 km/h, according to the American Geophysical Union.
For the Earth side, see our explainers on why cyclones spin anticlockwise and how pressure differences drive winds and cyclones.
How big is the Great Red Spot compared with Earth?
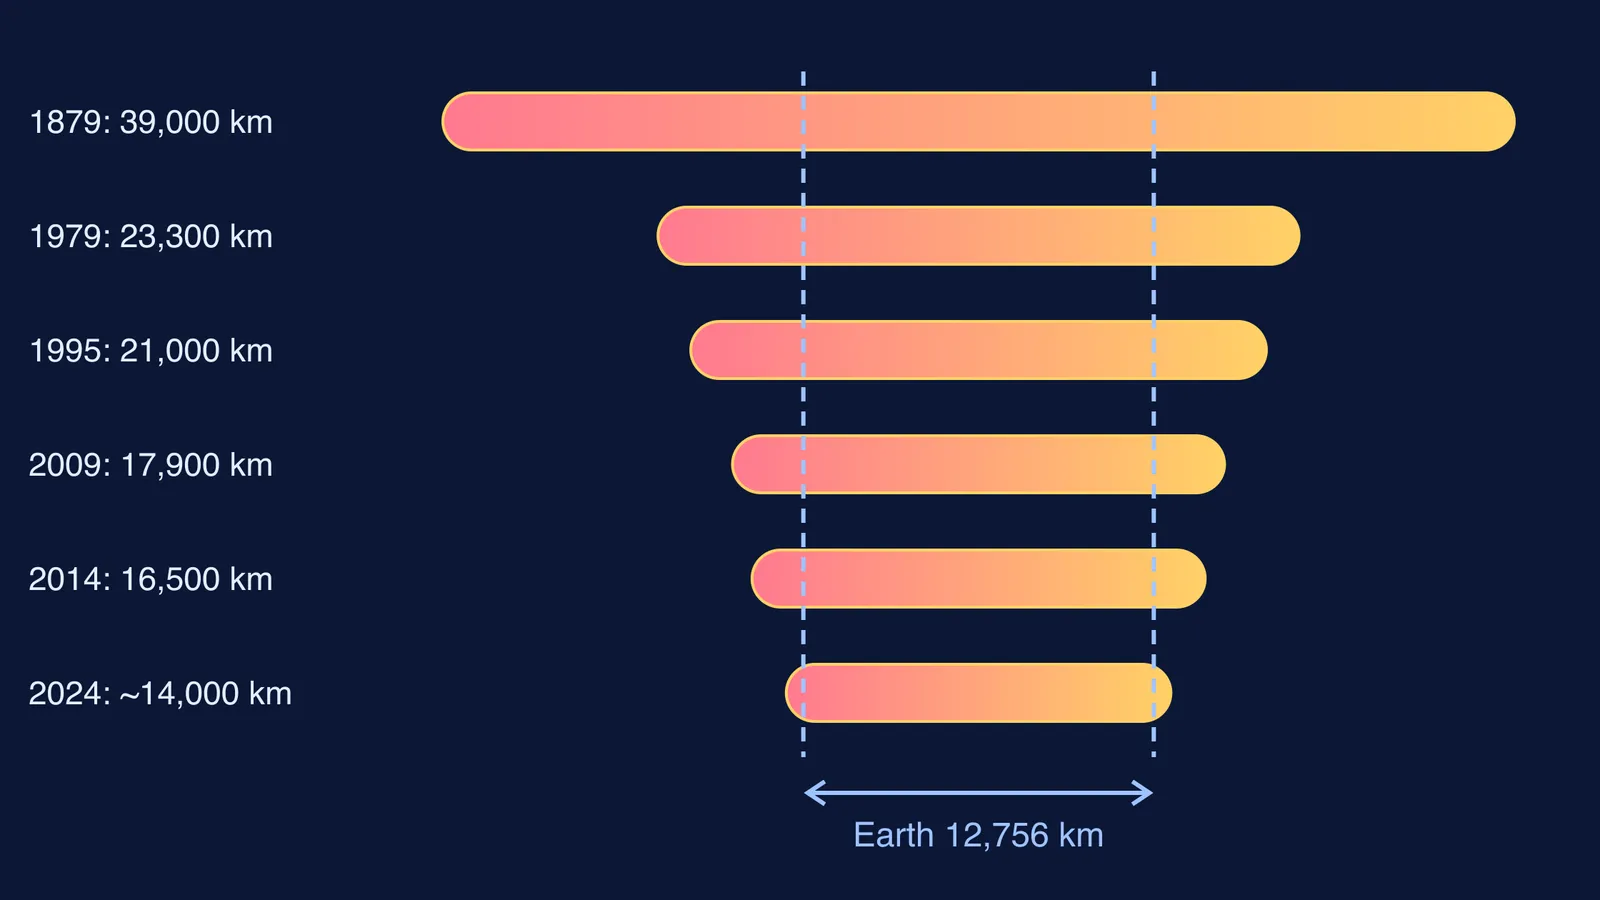
Here is a worked example using measured numbers. Earth's equatorial diameter is 12,756 km, according to NASA's Earth facts. The Great Red Spot is now about 14,000 km across its long axis, and in 1879 it measured about 39,000 km, according to the AGU release.
Today: 14,000 ÷ 12,756 ≈ 1.1, so the spot is only a little wider than Earth.
In 1879: 39,000 ÷ 12,756 ≈ 3.1, so about three Earths could have sat side by side across it.
Average shrinking rate: (39,000 − 14,000) ÷ (2024 − 1879) = 25,000 ÷ 145 ≈ 170 km per year.
Step 3 hides a speed-up. NASA's Hubble team reported that from 2012, amateur observers saw the spot shrinking by about 580 miles (roughly 930 km) a year, more than five times the long-run average. A single average can hide that.
The storm is deep as well as wide. Gravity measurements from NASA's Juno spacecraft showed it is no more than 500 km deep, according to Parisi and colleagues' 2021 paper in Science.
How old is the Great Red Spot, really?
You will often read that the storm is more than 300 years old, and NASA's Jupiter facts page still says so. That figure goes back to 1665, when the astronomer Giovanni Cassini saw a dark oval at the same latitude, the "Permanent Spot", which was observed until 1713.
A 2024 study in Geophysical Research Letters led by Agustín Sánchez-Lavega compared old drawings, sizes and motions, and concluded that Cassini's spot is unlikely to be today's storm. The current Great Red Spot was first reported in 1831, so it has lasted at least 190 years. Their simulations suggest it formed from a disturbance in the flow between the two opposing jet streams, not from storms merging.
Why is the Great Red Spot shrinking?
Nobody has a full answer yet. A 2018 study in The Astronomical Journal by Amy Simon and colleagues, using more than 150 years of observations, found the spot still shrinking east to west faster than north to south, so it is becoming rounder. In 2014, NASA reported that Simon's team saw very small eddies feeding into the storm and suggested these may change its internal dynamics. More recently, NASA described the storm behaving like a stress ball: over about 90 days of Hubble observations from December 2023 to March 2024, it squeezed in and out as it sped up and slowed down, pushing against the jet streams to its north and south. The cause of this oscillation is still unknown.
How can you think about it like a physicist?
Use this checklist the next time you meet a storm, on Jupiter or on the weather map:
Is the centre high or low pressure? That decides which way it spins.
Which hemisphere is it in? The spin direction flips between hemispheres.
What keeps it in place? For the Great Red Spot, the jet streams on either side.
Is the size number current? Check the date beside every measurement.
Is a rate steady or speeding up? Compare short-term and long-term averages.
Rotating fluids are hard to picture from a still photo. The Fermi Simulation Lab has interactive simulations for ideas that are easier to see than to read. If a term like "vorticity" or "pressure gradient" is new, the Fermi Concept Library gives each concept its own lesson.
For how the first telescope views of Jupiter changed astronomy, read about Galileo and the moons of Jupiter.