
On this page
The stress-strain graph in your Class 11 elasticity chapter records one experiment: a wire pulled harder until it snaps. Know its four points and most questions on it get quick.
What do stress and strain mean on the graph?
Tensile stress is the deforming force divided by the cross-sectional area, F/A, and tensile strain is the fractional change in length, ΔL/L (OpenStax University Physics, section 12.3). Because both divide out the wire's size, the curve describes the material, not one wire.
Young's modulus is the constant that links stress to strain in the linear elastic range. The same OpenStax table gives it as 20.0 × 10^10 Pa for steel, 11.0 × 10^10 Pa for copper and 7.0 × 10^10 Pa for aluminium.
How do you read the stress-strain curve of a wire, point by point?
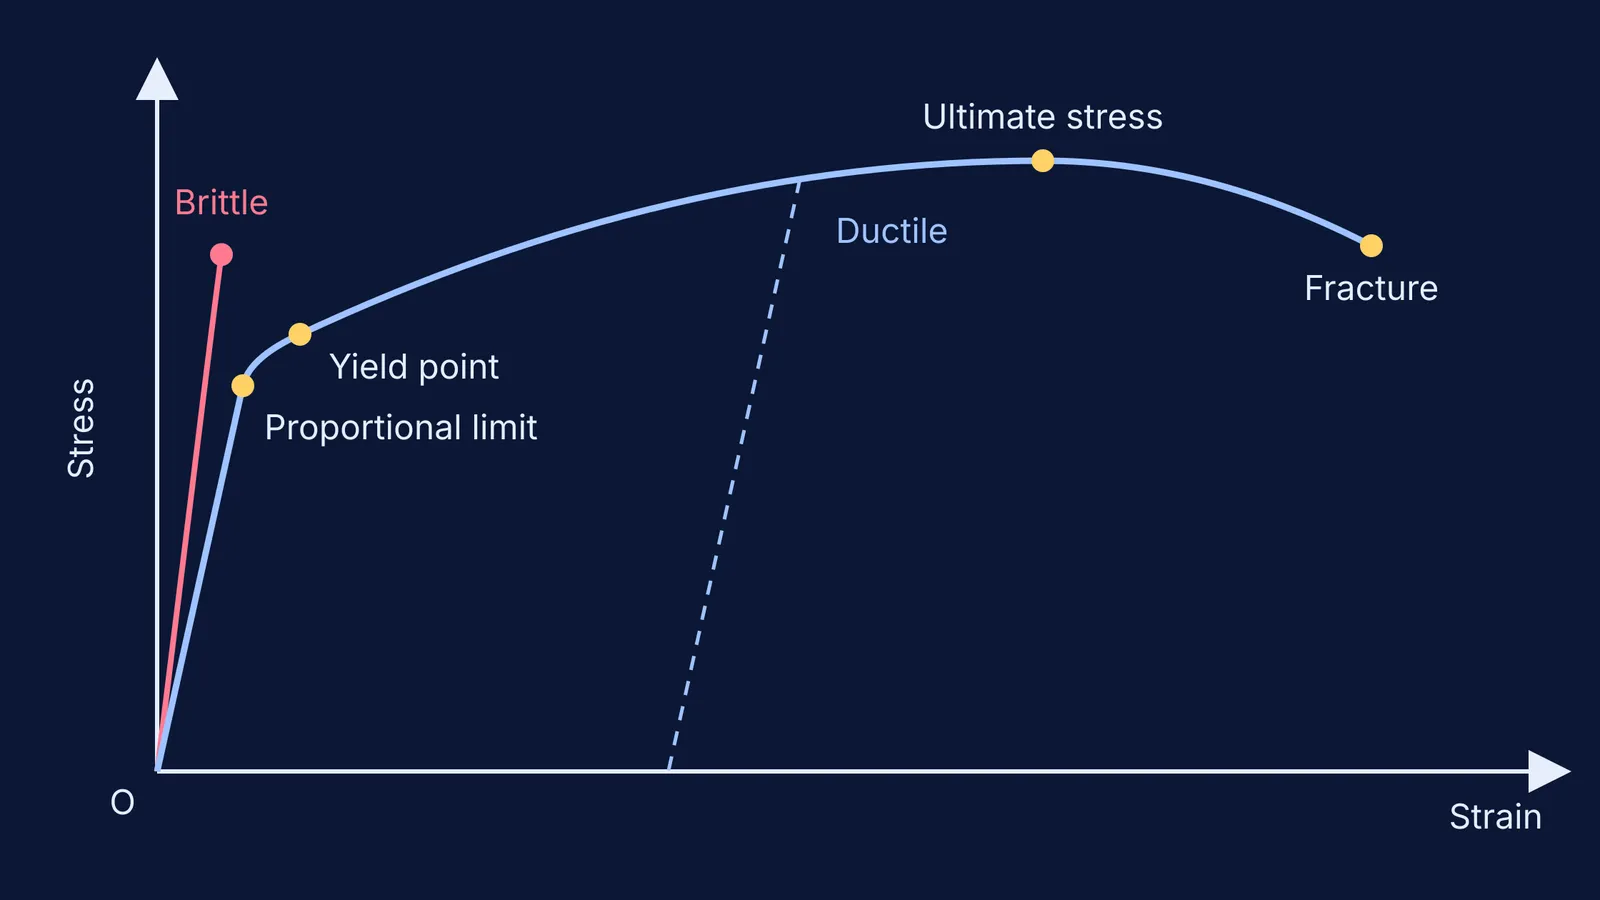
Move along the curve from the origin, as in the diagram above. Definitions are from OpenStax University Physics, section 12.4 and a University of Alabama in Huntsville study handout on stress and strain.
Origin to the proportional limit. The graph is a straight line, so Hooke's law holds and the slope is Young's modulus. The proportional limit is the largest stress beyond which stress is no longer proportional to strain.
Proportional limit to elastic limit. The wire is still elastic, but the relation is no longer linear.
Elastic limit and yield point. The yield point is the dividing point between elastic and plastic behaviour. Beyond it the wire deforms permanently: unload it and it returns along the dashed line, staying longer than it started.
Ultimate stress. The highest point on the curve. After it, a ductile wire necks (thins at one spot) and the stress falls.
Fracture. The wire breaks, and the graph ends.
One naming trap: OpenStax calls the stress at the fracture point the breaking stress (or ultimate stress), while the UAH handout keeps ultimate strength and fracture point as two separate points. Check which convention your textbook and the question use before you answer.
How do ductile and brittle materials differ on the curve?
The UAH handout puts the difference in one line each. A ductile material stretches a lot and necks before failure, and it may stay in the plastic region for a long time. A brittle material shows very little elongation before it fails, and its fracture point lies very close to, or at, its ultimate strength.
On a graph, a ductile curve has a long plastic stretch after the yield point, while a brittle curve rises almost straight and stops suddenly. Strength is a separate property. OpenStax gives the ultimate stress of aluminium as 2.2 × 10^8 Pa and of steel as up to 20.0 × 10^8 Pa (section 12.4), and OpenStax describes metals like these as ductile.
What questions do exams set on the stress-strain curve?
The same few patterns keep coming back:
Two curves, A and B. A steeper starting line means a larger Young's modulus, a longer plastic region means more ductile, and a higher peak means greater ultimate strength.
Where does Hooke's law hold? Only from the origin to the proportional limit.
Breaking load of another wire. Breaking stress belongs to the material, so breaking load is that stress times the area. Double the radius and the load goes up four times. Double the length and nothing changes.
Unloading past the yield point. The wire keeps a permanent extension.
A worked example
Suppose the straight part of a wire's graph ends at a stress of 2.0 × 10^8 Pa and a strain of 1.0 × 10^-3 (made-up exam numbers). Then Young's modulus is 2.0 × 10^8 ÷ 1.0 × 10^-3 = 2.0 × 10^11 Pa. That is 20 × 10^10 Pa, the value OpenStax lists for steel.
For a 2.0 m wire with a cross-section of 1.0 mm² (1.0 × 10^-6 m²), the largest load within Hooke's law is stress × area = 200 N, and the extension then is strain × length = 2.0 mm.
If the graph peaks at 8.0 × 10^8 Pa, the breaking load is 800 N. A 4.0 m wire of the same thickness also breaks at 800 N; one with twice the radius breaks at 3200 N.
How should you practise reading these graphs?
Use this checklist on every stress-strain question:
Read the axes first. Some questions put strain on the vertical axis, and then the slope is 1/Y.
Mark the proportional limit, yield point, ultimate stress and fracture before you read the options.
Take slopes only on the straight part.
Turn stress into load with the area, never the length.
If the definitions themselves feel shaky, the Fermi Concept Library gives elasticity its own lesson and shows where it sits next to the ideas around it. When you get the right method but the wrong answer, the Fermi Problem Library has a step-by-step solver that explains the reasoning rather than printing an answer.
For more practice, work through our solved problems on stress, strain and Young's modulus, then go on to elastic potential energy in a stretched wire, which comes from the area under the straight part of this same curve.