On this page
If your syllabus has the chapter Poverty as a Challenge, it asks four things: how poverty is measured, who is most at risk, why it persists and what governments do about it. Below is each part with current official data, then a plan for a 5-mark answer.
The current CBSE Class 9 Social Science curriculum for 2026-27 still asks students to gather and analyse data on income, poverty and employment, and covers welfare economies and social safety nets in its Building Blocks in Economics theme.
What is the poverty line?
A poverty line is the minimum income or consumption a person needs to meet basic needs; anyone below it is counted as poor.
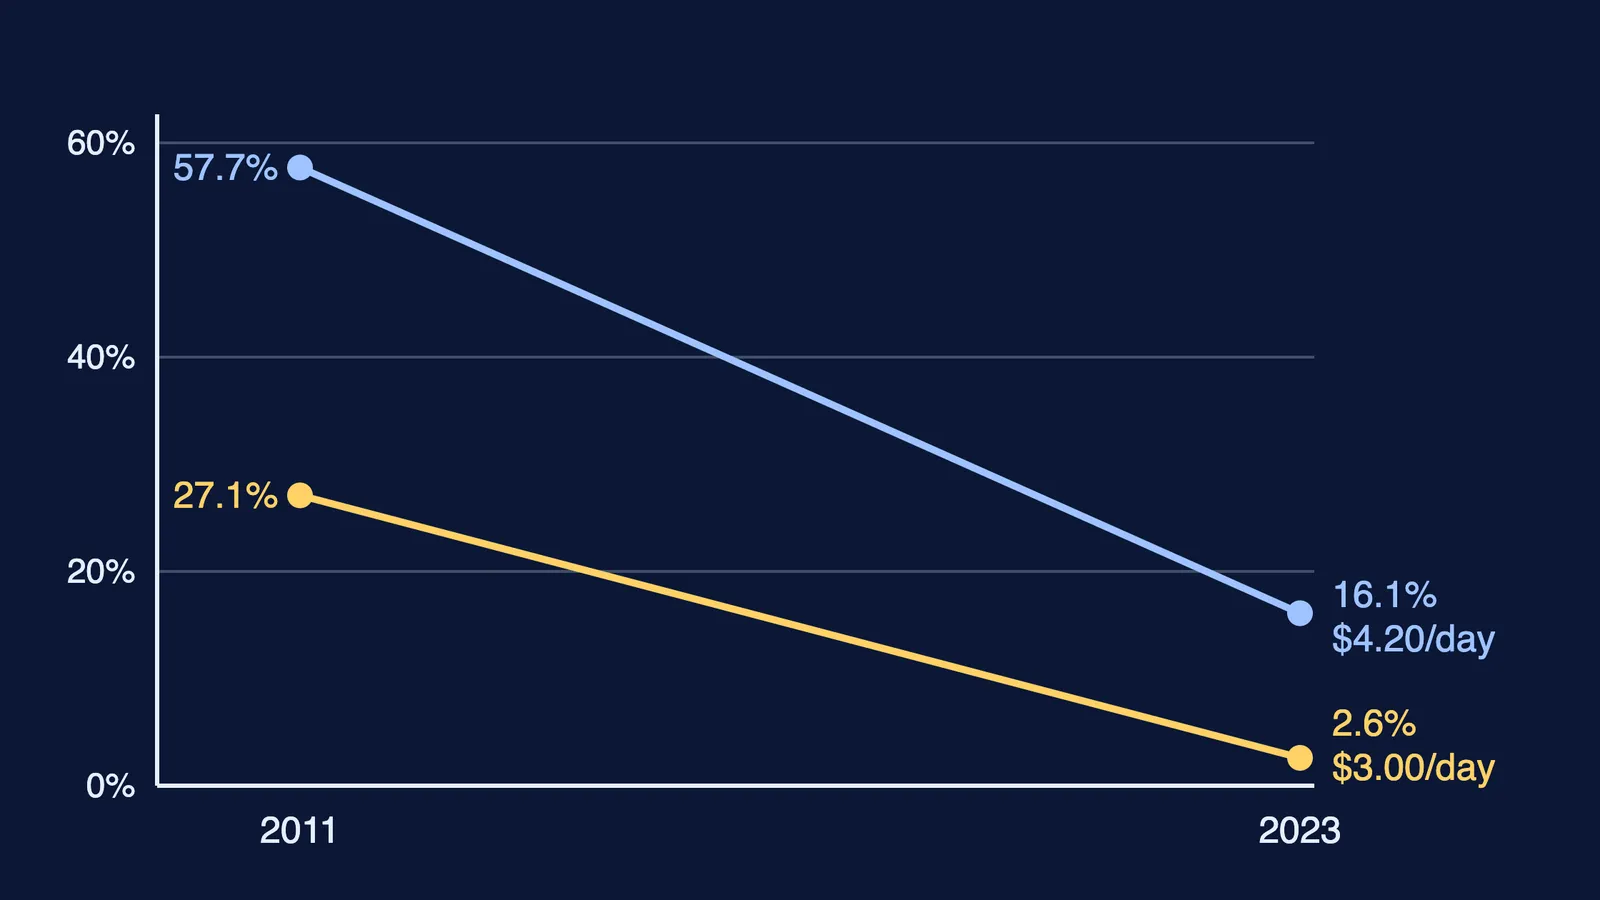
The World Bank's international poverty line is $3.00 per person per day in 2021 purchasing-power terms, and it replaced the older $2.15 line in June 2025 (World Bank).
India's National Multidimensional Poverty Index, prepared by NITI Aayog, uses 12 indicators across health, education and standard of living, including nutrition, years of schooling, cooking fuel, sanitation, maternal health and bank accounts (NITI Aayog discussion paper). For how consumption baskets and lines are drawn up, read our explainer on how the poverty line is measured.
Which groups are most vulnerable to poverty?
The World Bank's India Poverty and Equity Brief (October 2026) shows who was poor in 2023 at its $4.20-a-day line:
Rural people: 19.3%, against 8.6% in towns and cities.
Children aged 0 to 14: 21.8%, the highest of any age group.
Adults with no education: 21.3%, against 7.4% for those with college-level education.
Women: 16.6%, against 15.7% for men.
Poverty is also concentrated by place: the same brief says a belt of states from Uttar Pradesh to West Bengal holds about 57% of India's poor.
What are the main causes of poverty in India?
The World Bank brief says poverty is now concentrated among households with less education, fewer assets, limited access to stable jobs and more dependants per earner, and that many poor households live in rural areas where productivity is lower. It also found that median earnings of the top 10% of workers were about 13 times those of the bottom 10% in 2023.
Link the causes as a chain, each feeding the next:
Little schooling limits the work a person can get.
That work is casual or low-productivity, so earnings are low and irregular.
Low earnings leave few assets and no cushion when illness or a bad harvest hits.
With many dependants per earner, children may leave school early, and the cycle starts again.
Our guide to building a cause-and-effect chart for a chapter shows how to turn this into a one-page revision diagram.
What has India done to reduce poverty?
India has used two approaches: faster economic growth, and programmes aimed directly at poor households. The World Bank brief credits the fall in poverty mainly to consumption growth, rising employment (especially among women) and wider social transfers, including food subsidies. On its numbers, extreme poverty at $3.00 a day fell from 27.1% to 2.6% between 2011 and 2023, though the Bank says part of the latest fall may reflect better measurement.
NITI Aayog estimates that multidimensional poverty fell from 29.17% in 2013-14 to 11.28% in 2022-23, with about 24.82 crore people leaving it (NITI Aayog). Both years are estimated from survey trends, not measured directly.
The rural job guarantee has changed, so older textbooks are out of date here. The Mahatma Gandhi National Rural Employment Guarantee Act (MGNREGA), 2005 was repealed on 1 July 2026 and replaced by the Viksit Bharat – Guarantee for Rozgar and Ajeevika Mission (Gramin) (VB-G RAM G) Act, 2025 (PIB). The new Act guarantees 125 days of wage work in each financial year, up from 100, to every rural household whose adults volunteer for unskilled manual work (PIB FAQ). Mention the change when a question asks about current measures.
How do you write a 5-mark answer on poverty?
Try this question: "Explain three causes of poverty in India and one measure to reduce it." A five-step plan, with figures from the World Bank brief:
Open with a one-line definition of the poverty line.
Give three causes as a chain (little schooling, insecure work, few assets), one point each.
Add one sourced number: rural poverty is more than twice urban poverty at the $4.20 line (19.3% against 8.6%).
Name one measure and what it does, such as a legal guarantee of paid days of rural work.
Close with one sentence linking that measure back to a cause you named.
If you are revising several chapters and don't know where to begin, Fermi's AI tutor can work out what you already know and build a plan for the session, so you sit down to a clear next step.