On this page
A real pendulum never swings forever; this Class 11 practical measures how fast it dies down. The CBSE Physics curriculum for 2026-27 lists it as Section A activity 7: "To study dissipation of energy of a simple pendulum by plotting a graph between square of amplitude and time." Your record must include at least 6 activities, and the 30-mark practical exam gives 3 marks to one activity.
What does the pendulum damping activity ask you to do?
The method is Activity 7 in the NCERT Class 11 Physics Laboratory Manual. You need a heavy metal bob on 1.5 m to 2 m of strong cotton thread, a metre scale and a balance. In short:
Weigh the bob and hang the pendulum.
Fix a metre scale just below the bob, in the plane of the swing, zero mark under the bob at rest.
Pull the bob to the 15 cm mark and let go gently.
Count oscillations each time the bob reaches its furthest point on the same side, reading the amplitude to 0.5 cm.
Record the amplitude after every 5 oscillations (or every 10).
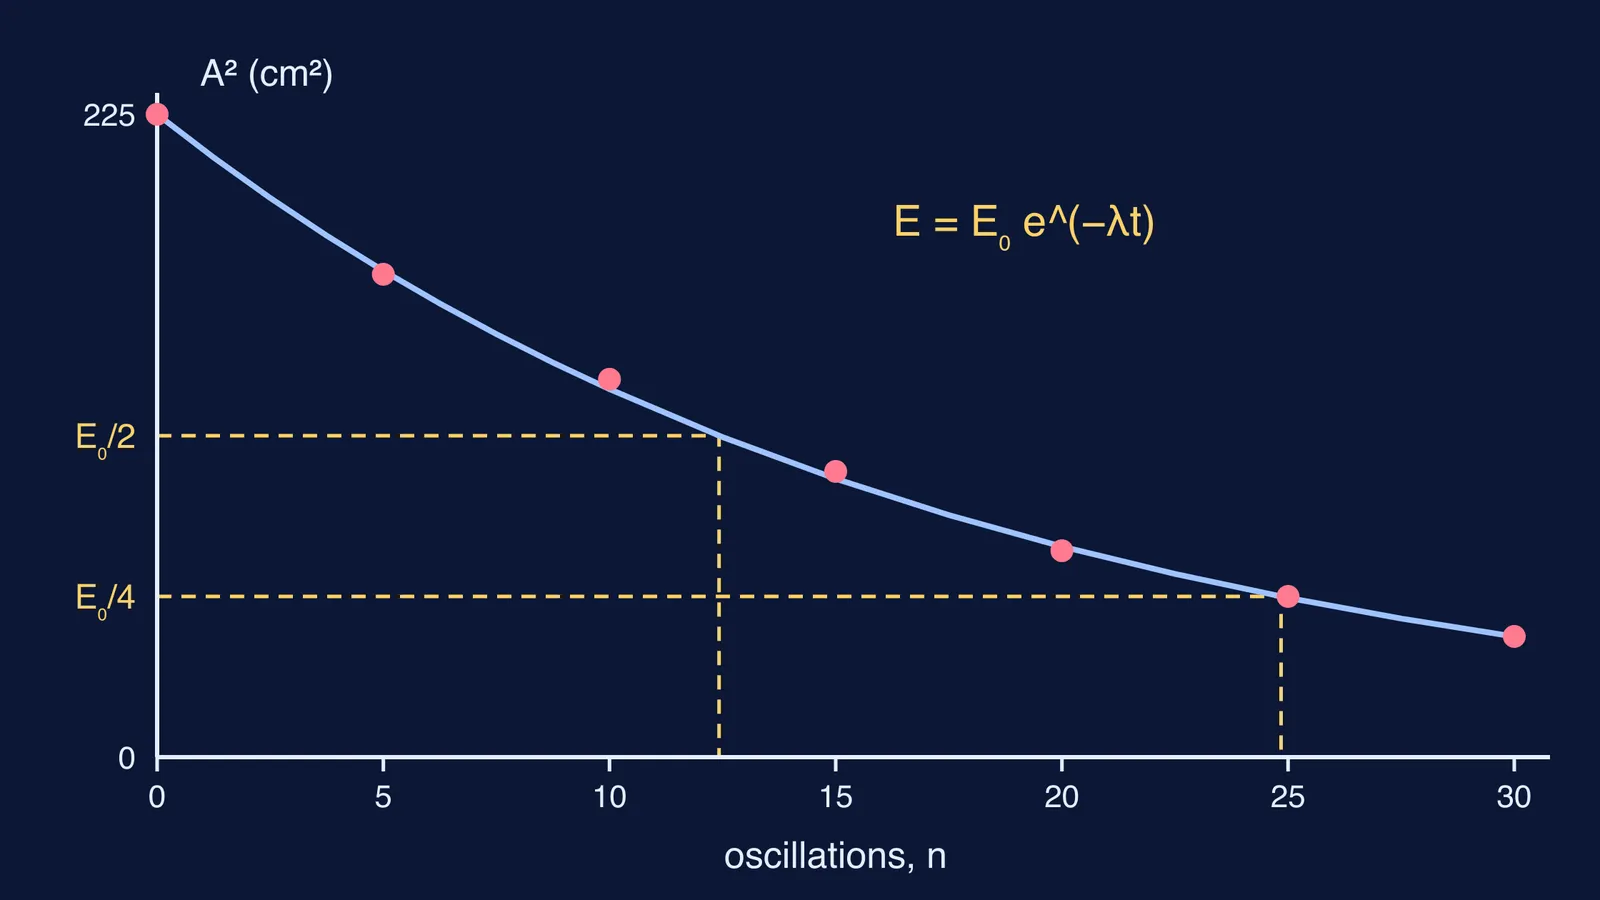
Plot amplitude squared against the number of oscillations, n.
Stick cotton or a paper strip to the bob to increase damping, and repeat.
Counting oscillations replaces a stopwatch: the frequency hardly depends on amplitude, so t = nT.
Why plot amplitude squared, not amplitude?
A pendulum's total energy is E = ½kA², where k = mg/L, according to the NCERT laboratory manual. So a graph of A² against n is an energy-time graph with a different y-axis scale.
In a real pendulum the amplitude falls as A = A₀e^(−λt/2), and the energy as E = E₀e^(−λt), where λ depends on the damping and the mass of the bob. The manual names the culprits: air drag, play at the suspension, and a string and support that are not perfectly rigid.
If ½kA² or damping still feels shaky, the Fermi Concept Library gives every physics concept its own lesson.
What should your readings look like? A worked example
These are sample readings, not real measurements: we generated them from an exponential and rounded to 0.5 cm.
n = 0: A = 15.0 cm, A² = 225 cm²
n = 5: A = 13.0 cm, A² = 169 cm²
n = 10: A = 11.5 cm, A² = 132.25 cm²
n = 15: A = 10.0 cm, A² = 100 cm²
n = 20: A = 8.5 cm, A² = 72.25 cm²
n = 25: A = 7.5 cm, A² = 56.25 cm²
n = 30: A = 6.5 cm, A² = 42.25 cm²
Now test for exponential decay. Divide each A² by the one before it: 0.75, 0.78, 0.76, 0.72, 0.78, 0.75. The ratio stays near 0.76: every five swings remove about a quarter of the energy left, so the curve flattens rather than falling in a straight line.
It also gives a constant halving time: A² falls to half its starting value at about n = 12, and to a quarter at n = 25.
In joules, for a 100 g bob and an effective length of 1.5 m: k = mg/L = 0.653 N/m, E₀ = ½ × 0.653 × 0.15² ≈ 0.0073 J, and after 30 oscillations E ≈ 0.0014 J. About four-fifths of the energy has gone.
What if your graph does not look like the textbook curve?
Points jump up and down. The manual says accurate measurement of amplitude is difficult. Read the scale from directly above, and let a partner count aloud.
The bob traces an ellipse. Let it swing a couple of oscillations before recording, and work where air flow is minimum: fans off.
The amplitude falls in a straight line. A pure exponential assumes damping proportional to speed. A paper by Avinash Singh on arXiv notes that common damping terms, such as contact friction, air resistance and viscous drag, depend on velocity as a constant, v or v², and that each gives the amplitude decay a characteristic dependence on the starting amplitude. Tighten a loose clamp; if the shape persists, report it honestly.
The cotton run falls faster. Expected: more damping means a larger λ and a steeper curve.
How do you write the result and answer viva questions?
The manual's result reads: "From the graphs, we may conclude that the energy of a simple pendulum dissipates with time." Add your own numbers, such as how many oscillations A² took to halve, with and without the cotton.
The discussion questions ask which graph you prefer (A²–n, because it tracks energy directly) and how bob size, bob mass and length would change the decay. A bigger bob catches more air. A heavier bob of the same size carries more energy for the same drag, so you would expect it to lose a smaller fraction per swing.
For practice turning formulas like E = ½kA² into numbers, the Fermi Problem Library has worked problems with a step-by-step solver that explains the reasoning rather than printing an answer.