On this page
You have a grouped frequency table, a question asking for the median, and a formula with five letters. The usual slips are picking the wrong class or the wrong lower limit, not the arithmetic. Here is the whole method, including the boundary step for classes written as 1–10, 11–20.
What is the formula for the median of grouped data?
The median of grouped data is l + ((n/2 − cf)/f) × h, as set out in the Class 10 statistics notes on SATHEE, the Ministry of Education and IIT Kanpur learning platform. Each letter means one thing:
l: lower limit of the median class
n: total number of observations (the sum of all frequencies)
cf: cumulative frequency of the class just before the median class
f: frequency of the median class
h: class width
The formula assumes the observations inside the median class are spread evenly across it. You know cf observations lie below l, so you need (n/2 − cf) more to reach the middle. Those sit in a class holding f observations over a width of h, so you move (n/2 − cf)/f of the way across it.
How do you find the median class?
Add a cumulative frequency column: each entry is the running total of the frequencies so far. The last entry must equal n; if it does not, a sum has gone wrong. Then work out n/2 and go down the column. The median class is the first class whose cumulative frequency reaches or passes n/2. For a refresher, our guide to less-than and more-than cumulative frequency walks through both types.
The formula uses n/2 whether n is odd or even, because grouped data is treated as spread continuously across each class. If a cumulative frequency lands exactly on n/2, either neighbouring class gives the same answer: the boundary between them.
What changes when classes are inclusive, like 11–20?
In inclusive classes both limits belong to the class, so there is a gap between 20 and 21. The formula needs continuous classes, where one class ends exactly where the next begins. Class boundaries sit halfway between the upper limit of one class and the lower limit of the next, as Mathwords shows with the classes 10–19 and 20–29. With whole-number data the gap is 1, so you subtract 0.5 from every lower limit and add 0.5 to every upper limit: 11–20 becomes 10.5–20.5.
Two things change. l becomes the true lower boundary (10.5, not 11), and h becomes the distance between boundaries (10, not 9). Our post on class limits in a grouped frequency table covers this conversion in more detail.
Worked example: median marks of 50 students
A class test marked out of 50 gave this table (made up for practice):
1–10: 4 students
11–20: 9 students
21–30: 15 students
31–40: 13 students
41–50: 9 students
Cumulative frequencies: 4, 13, 28, 41, 50. The last entry is 50, so n = 50.
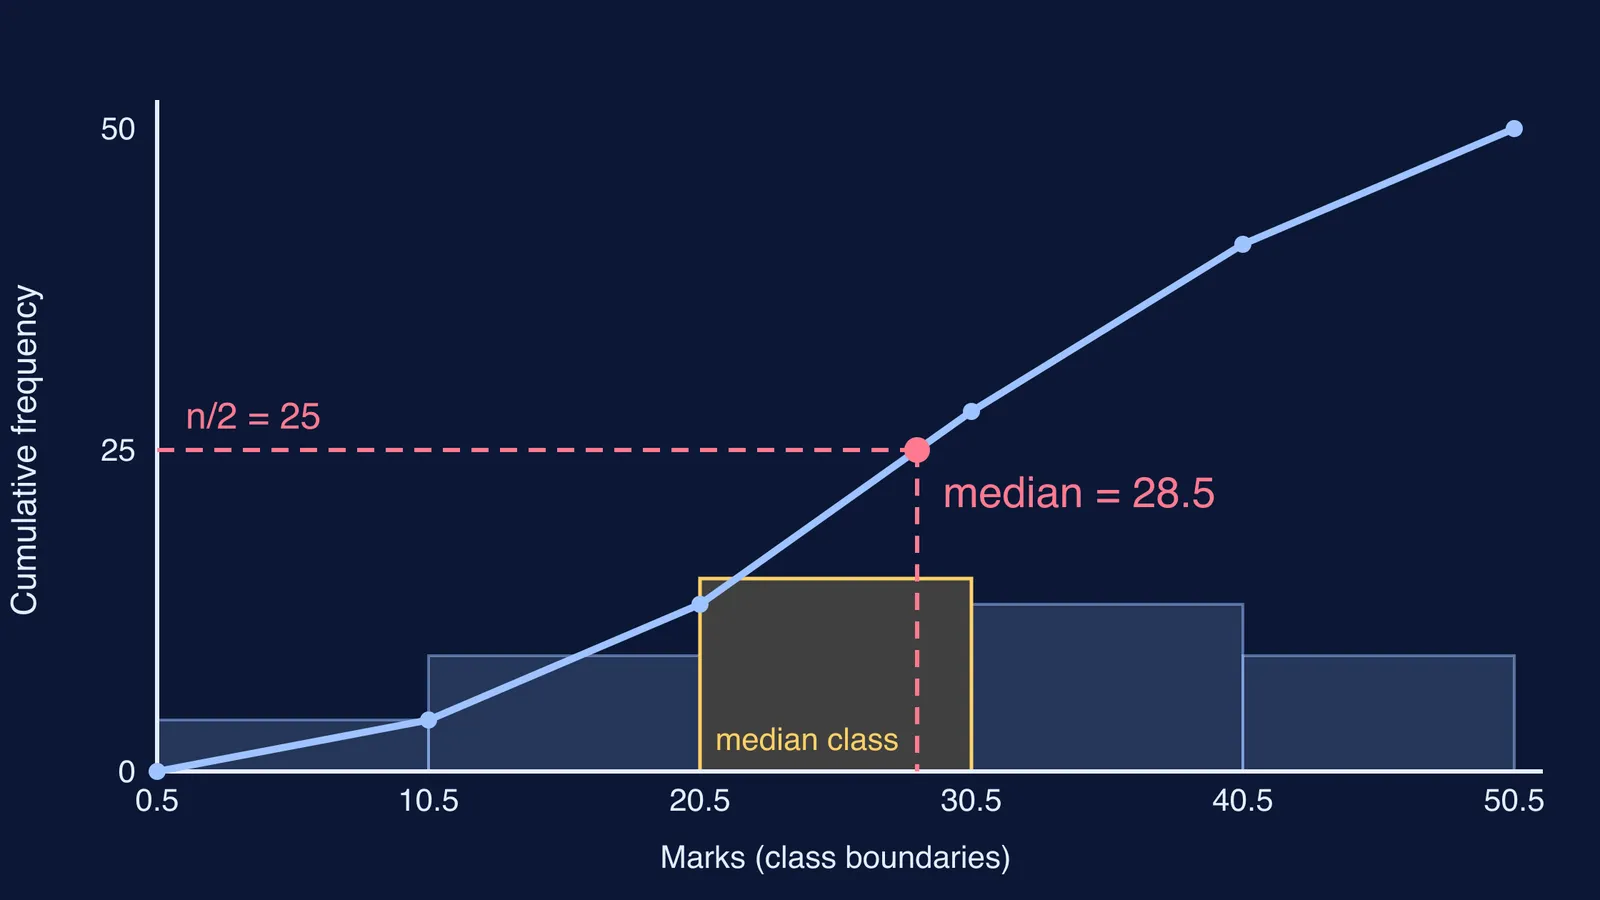
n/2 = 25. The first cumulative frequency to reach 25 is 28, so the median class is 21–30.
The classes are inclusive (20, then 21), so convert: 21–30 becomes 20.5–30.5.
Read off the values: l = 20.5, cf = 13 (from the class before), f = 15, h = 10.
Substitute: median = 20.5 + ((25 − 13)/15) × 10 = 20.5 + (12/15) × 10 = 20.5 + 8 = 28.5.
Check: 28.5 lies inside 20.5–30.5, so the answer sits in the right class.
If you skip step 3 and use l = 21, you get 29, which is 0.5 too high. If you also take h = 9 (30 − 21), you get 28.2. Both slips have the same cause: the formula was given classes with gaps.
The less-than ogive in the diagram above crosses cumulative frequency 25 at 28.5. Inside the median class, the formula is a straight-line reading of the ogive. To see that idea move, try our interactive ogive and median explainer.
Which mistakes cost marks on this question?
Run this checklist before you write the final answer:
cf is the cumulative frequency of the class before the median class, not of the median class itself.
f is the plain frequency of the median class, not its cumulative frequency.
l comes from the median class, not the class before it.
Inclusive classes are converted, and both l and h come from the boundaries.
The final answer lies inside the median class.
If you keep picking the wrong class or mixing up cf and f, work through similar questions in the Fermi Problem Library, where a step-by-step solver explains the reasoning rather than printing an answer. If the gap is in the idea itself, the Fermi Concept Library gives each mathematics concept its own lesson.
Next time, write the cumulative frequency column first; the rest of the question follows from it.