

On this page
In Class 10 you meet this formula at the end of the Statistics chapter. It is a shortcut, but only for the right kind of data.
What is the empirical relation between mean, median and mode?
The NCERT Class 10 Mathematics textbook states it as a remark in Chapter 13, Statistics: "There is a empirical relationship between the three measures of central tendency : 3 Median = Mode + 2 Mean" (NCERT, Chapter 13, page 197).
Exam questions use all three rearrangements:
Mode = 3 Median − 2 Mean
Median = (Mode + 2 Mean) ÷ 3
Mean = (3 Median − Mode) ÷ 2
"Empirical" means it was found by looking at real data, not proved from definitions. Wikipedia credits the rule to Karl Pearson and notes that it often holds for slightly skewed distributions resembling a normal curve, but not always (Wikipedia, Mode (statistics)). The link between the three measures was the subject of a 1917 Biometrika paper by A. T. Doodson, "Relation of the Mode, Median and Mean in Frequency Curves" (Biometrika record).
When does Mode = 3 Median − 2 Mean hold?
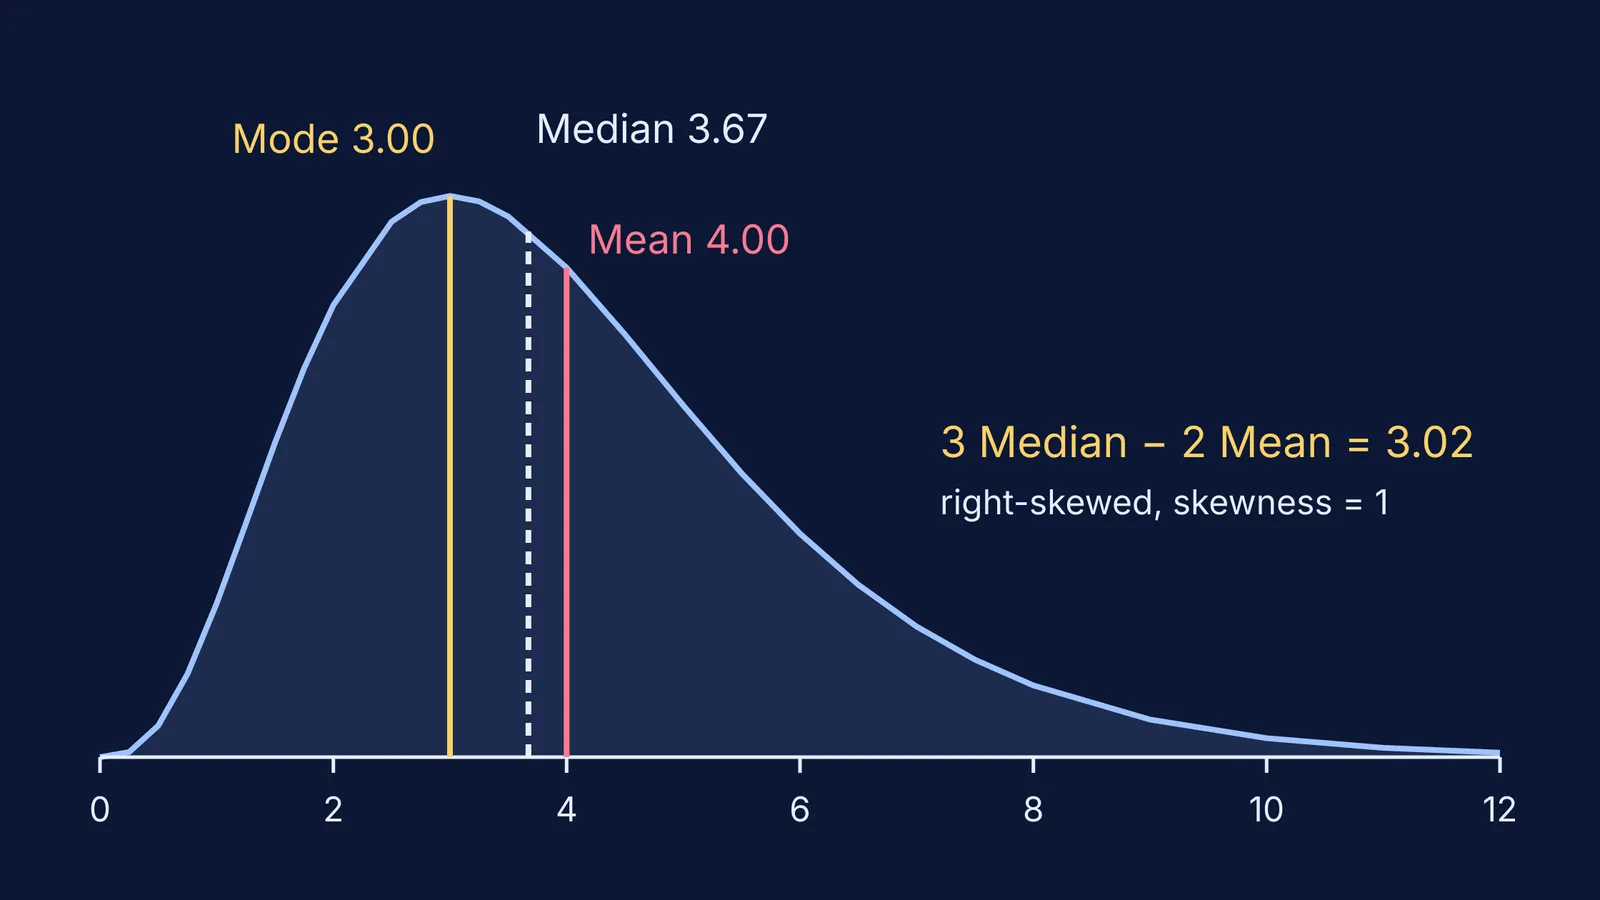
Picture a frequency curve with one peak and a tail stretched to one side, like marks in a hard paper. The mode sits at the peak, the mean is dragged furthest towards the tail, and the median sits between them, one third of the way from the mean to the mode.
In the diagram above we worked out all three for a right-skewed curve: mode 3.00, median 3.67, mean 4.00. The relation gives 3 × 3.67 − 2 × 4.00 = 3.02, very close to the true mode.
The relation, and the textbook picture behind it, can break down in three situations:
Two or more peaks. If half a class scored very low and half very high, the three measures can land in any order.
Discrete data with few values. The paper "Mean, Median, and Skew: Correcting a Textbook Rule" by Paul von Hippel in the Journal of Statistics Education (2005) found that for more than 30% of its parameter values the right-skewed Poisson distribution breaks a simpler textbook rule, that the mean lies right of the median.
A big pile-up at one value. In the same paper, von Hippel shows 2002 General Social Survey data on adults per US household with a long right tail, yet 49% of cases sat exactly at the median and the mean fell below the median and mode, the opposite of what the textbook picture predicts.
Worked example: does it hold for an NCERT table?
Take Exercise 13.3, Question 1 in the NCERT chapter: the monthly electricity use of 68 consumers, in classes 65-85, 85-105, ... 185-205 units, with frequencies 4, 5, 13, 20, 14, 8, 4.
Mean. Class marks are 75, 95, 115, 135, 155, 175, 195. The sum of f × x is 9320, so the mean is 9320 ÷ 68 = 137.06 units.
Median. n ÷ 2 = 34. The cumulative frequencies are 4, 9, 22, 42, so the median class is 125-145. Median = 125 + ((34 − 22) ÷ 20) × 20 = 137 units.
Mode. The modal class is also 125-145, with f1 = 20, f0 = 13, f2 = 14. Mode = 125 + (7 ÷ 13) × 20 = 135.77 units.
Check. 3 × 137 − 2 × 137.06 = 136.88 units.
The relation gives 136.88 against the grouped mode of 135.77, a gap of about 1.1 units: one peak, a mild tail, exactly where the rule should work. For the grouped formulas step by step, see our guide to finding the modal class and applying the mode formula.
What Class 10 questions use the empirical relation?
CBSE sample papers have tested it as a one-mark multiple-choice question:
Pick the correct form. Question 2 of the CBSE Class X Mathematics-Basic sample paper for 2019-20 asks which option is the empirical relationship; the right choice is 2 Mean = 3 Median − Mode.
Match the coefficients. Question 14 of the 2025-26 Mathematics Basic sample paper writes a(Median) = Mode + b(Mean) and asks for 2b + 3a. With a = 3 and b = 2, the answer is 13.
Find the missing measure. For example, if the mean is 26 and the median is 27, then Mode = 3 × 27 − 2 × 26 = 29.
One trap: if a question gives the full frequency table and asks for the mode, use the grouped-data mode formula, not the relation. The mean formula can also be run backwards, as in our guide on how to find the missing number when the mean is given.
If you keep mixing up which formula a question needs, the Fermi Problem Library has worked problems with a step-by-step solver that explains the reasoning rather than printing an answer. If the measures themselves feel shaky, the Fermi Concept Library gives every mathematics concept its own lesson and its place in the map, so you can see what to revise first.


