On this page
If you have ever lost a board-exam mark multiplying 92.5 by 6, the step-deviation method is for you. It does not change the answer; it moves the arithmetic onto small whole numbers and puts the scale back at the end.
What is the step deviation method for grouped data?
In NCERT's Class 10 Mathematics chapter on statistics, the mean of grouped data is found by treating every value in a class as if it sat at the class mark, the mid-point of that class. NCERT states this as an assumption: the frequency of each class interval is taken to be centred around its mid-point.
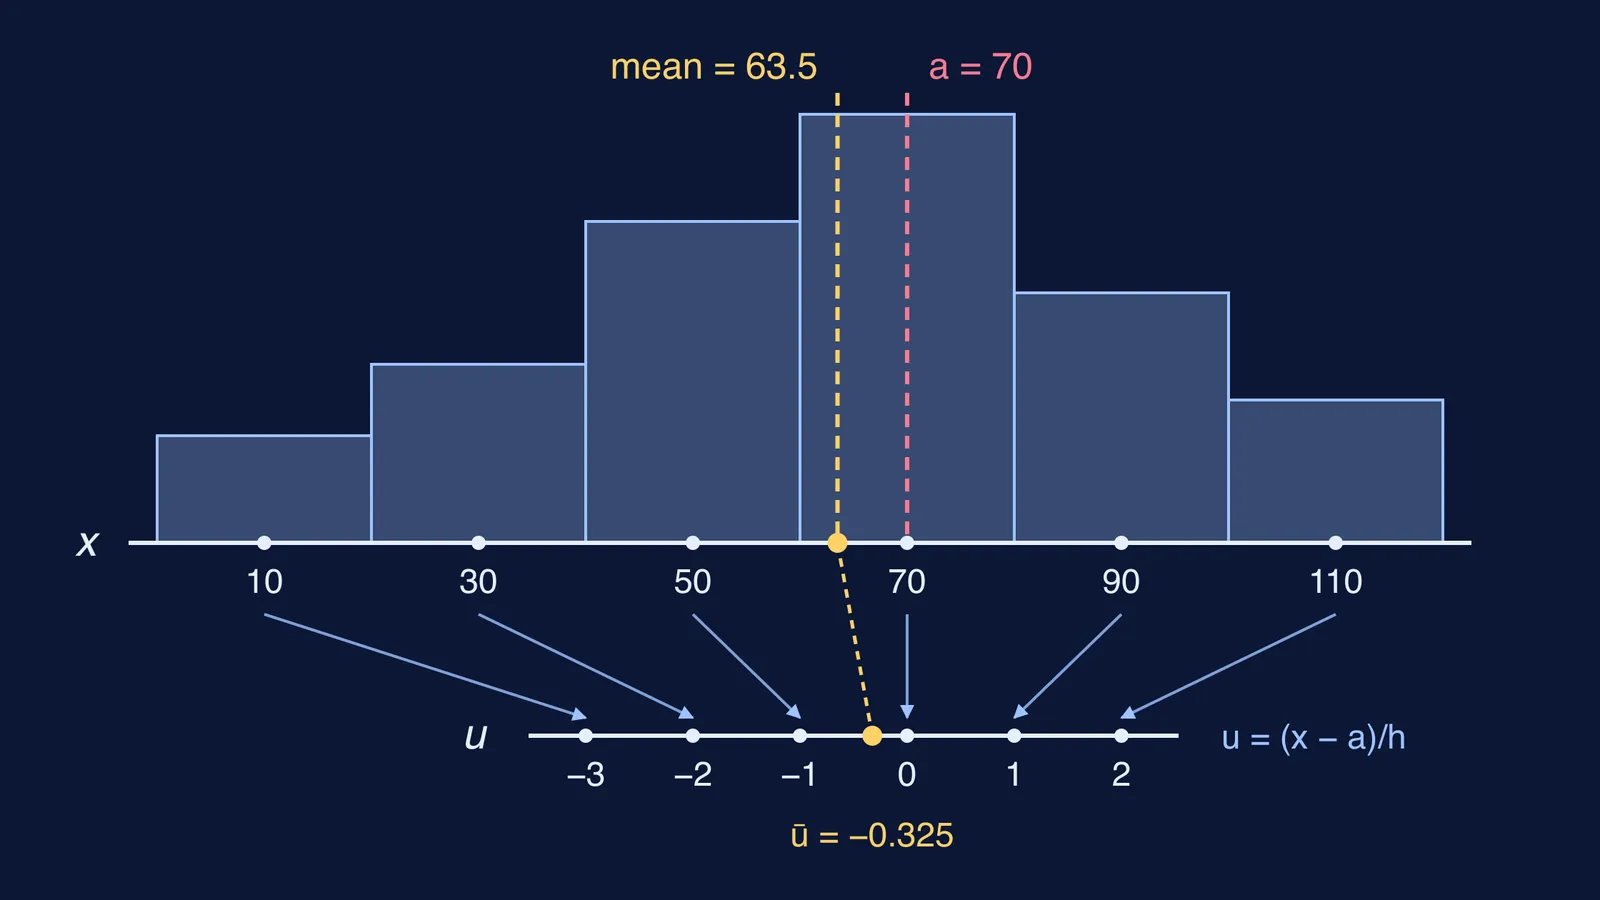
The step-deviation method replaces each class mark x with u = (x − a)/h, where a is the assumed mean and h is the class size (NCERT, Chapter 13). The mean is then a + h × (Σfu ÷ Σf). In effect, you slide the zero to a and measure in steps of h.
How do you find the mean of grouped data three ways?
Here is a made-up table, worked with NCERT's formulas: minutes spent on homework one evening by 40 students.
0–20 minutes: 3 students (class mark 10)
20–40: 5 students (class mark 30)
40–60: 9 students (class mark 50)
60–80: 12 students (class mark 70)
80–100: 7 students (class mark 90)
100–120: 4 students (class mark 110)
In every method, Σf = 40.
Way 1, direct method. Multiply each class mark by its frequency: 30, 150, 450, 840, 630, 440. These add up to Σfx = 2540. Mean = 2540 ÷ 40 = 63.5 minutes.
Way 2, assumed mean method. Take a = 70, the class mark of the busiest class. The deviations d = x − 70 are −60, −40, −20, 0, 20, 40. Multiply each by f: −180, −200, −180, 0, 140, 160. So Σfd = −260, and the mean = 70 + (−260 ÷ 40) = 70 − 6.5 = 63.5 minutes.
Way 3, step deviation method. Every d is a multiple of 20, the class size, so take h = 20. Then u = d ÷ 20 gives −3, −2, −1, 0, 1, 2. Multiply each by f: −9, −10, −9, 0, 7, 8. So Σfu = −13 and ū = −13 ÷ 40 = −0.325. Mean = 70 + 20 × (−0.325) = 70 − 6.5 = 63.5 minutes.
Same answer three times. The biggest product in Way 1 was 70 × 12 = 840; in Way 3 none went past 10 in size.
Does the choice of assumed mean change the answer?
No. NCERT's chapter has students redo the calculation with each class mark as a, and concludes that the mean does not depend on the choice of a. The same section says the assumed mean and step-deviation methods are just simplified forms of the direct method, and that a + hū still works for any non-zero a and h, as long as u = (x − a)/h.
Test it on our table with a = 50: u becomes −2, −1, 0, 1, 2, 3, the fu column is −6, −5, 0, 12, 14, 12, and Σfu = 27. Mean = 50 + 20 × (27 ÷ 40) = 63.5 minutes. A middle value of a just keeps the numbers small.
One limit: a grouped mean is an estimate. In NCERT's worked example, the raw marks of 30 students give an exact mean of 59.3, but grouped into classes they give 62, because of the mid-point assumption (NCERT, Chapter 13). All three methods share that assumption equally.
Which method should you use in the exam?
Small class marks, few classes: the direct method. Fewer steps, fewer slips.
Large class marks, deviations with no common factor: the assumed mean method.
Deviations with a common factor, usually from equal class widths: step deviation, the case NCERT calls convenient.
The question names a method: use that one and show every column heading.
What mistakes cost marks with step deviation?
Forgetting to multiply ū by h at the end. If your mean is −0.325 or 69.7 for a table that runs from 0 to 120, check this first.
Using a class limit, such as 20 or 40, instead of the class mark for x.
Dropping a minus sign in the fu column. Add the negatives and the positives separately, then combine.
Dividing by the number of classes (6 here) instead of Σf (40 here).
Picking h from one class when widths are unequal. Choose h as a factor of every deviation, so each u stays a whole number.
If your Way 3 answer keeps disagreeing with Way 1, the Fermi Problem Library has worked problems with a step-by-step solver that explains the reasoning rather than printing an answer, so you can see exactly which column went wrong.
Next, read our guide to mean, median and mode of grouped data in Class 10, or, if the shortcut is new to you, the assumed mean shortcut for everyday averages.