

On this page
When you clip a pulse oximeter onto your fingertip, a crimson glow shines through your nail bed while a digital display reveals your pulse rate and arterial oxygen saturation (SpO2). The device operates without puncturing skin or drawing blood, using spectrophotometry and cardiovascular biophysics to distinguish oxygen-saturated erythrocytes and haemoglobin chemistry from unbound haemoglobin molecules.
Why does a pulse oximeter use red and infrared light?
Oxygen transport in circulation relies on haemoglobin, an iron-containing quaternary protein packed inside red blood cells. When bound to oxygen in pulmonary capillaries, it forms oxyhaemoglobin (HbO2); upon releasing oxygen to tissues, it becomes deoxyhaemoglobin (Hb). Arterial oxygen saturation measures the percentage of oxygenated haemoglobin relative to total active haemoglobin.
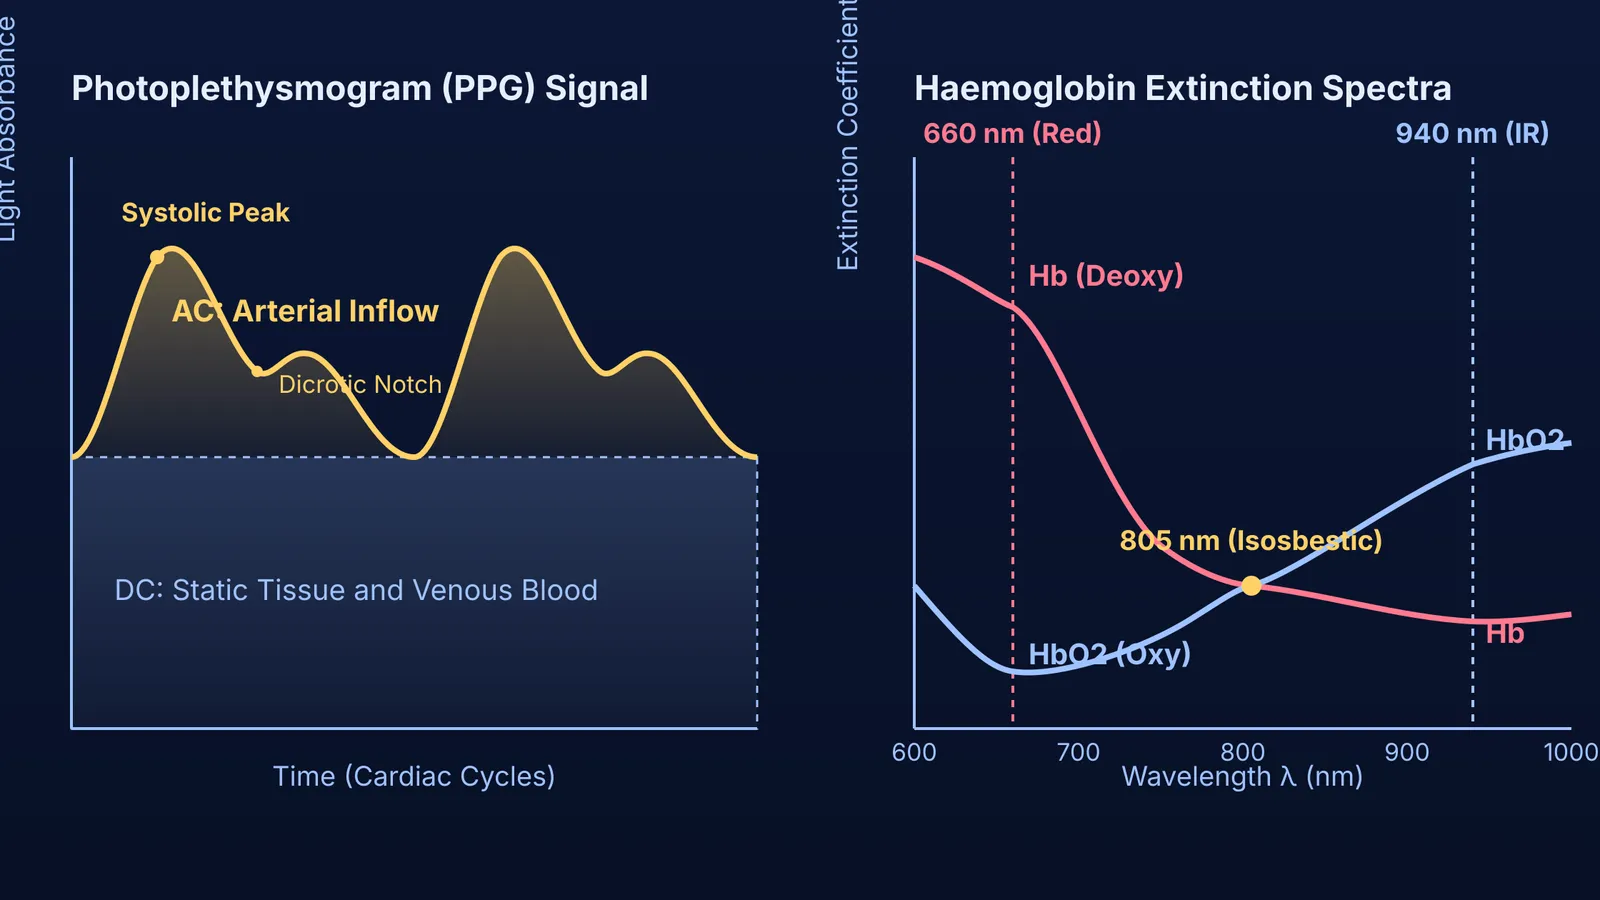
According to research in Respiratory Medicine by Edward Chan and colleagues, deoxyhaemoglobin and oxyhaemoglobin exhibit distinct molar extinction coefficients across visible and near-infrared bands. At 660 nm (red light), deoxyhaemoglobin absorbs roughly ten times more light than oxyhaemoglobin. Conversely, oxyhaemoglobin absorbs more strongly at 940 nm in the near-infrared band. At the 805 nm isosbestic point, both molecular forms absorb light identically. Finger oximeters exploit this difference by packaging two light-emitting diodes—calibrated to 660 nm and 940 nm—opposite a silicon photodiode. Reviewing how semiconductor photodiodes and light-emitting diodes operate under reverse bias clarifies how transmitted photons generate measurable photocurrents.
How does the sensor separate arterial blood from surrounding tissue?
Light traversing a finger encounters skin, bone, muscle, and venous blood. These static tissues absorb photons, producing background attenuation far larger than the optical signal of arterial blood.
In 1974, Japanese bioengineer Takuo Aoyagi at Nihon Kohden resolved this while refining dye-dilution measurements of cardiac output. As Aoyagi documented in the Journal of Anesthesia, transmitted light exhibited rhythmic fluctuations matching the heartbeat. Instead of discarding this as noise, Aoyagi realized it was the physiological signal.
During ventricular systole, each heartbeat expels blood into peripheral arterioles, increasing vascular diameter and optical path length. During diastole, arterial volume recedes. As detailed in our review of the cardiac cycle and arterial pulse pressure, venous blood and non-vascular tissues maintain a constant volume. The photodetector separates this into two parts:
A constant direct-current (DC) baseline from skin, bone, muscle, and venous blood.
A pulsatile alternating-current (AC) component caused exclusively by expanding arterial beds.
Dividing the pulsatile amplitude by the baseline level (AC / DC) normalizes the reading, cancelling differences in finger thickness and static tissue pigmentation.
How does the device calculate oxygen saturation from raw light signals?
Under the Beer-Lambert law, light absorbance equals the product of extinction coefficient ε, solute concentration c, and path length d (A = ε × c × d). In Critical Care, Amal Jubran explains that pulse oximeters compute a dimensionless ratio of ratios (R):
R = (AC_660 / DC_660) / (AC_940 / DC_940)
Consider a worked numerical example:
The sensor measures a normalized red pulsation (AC_660 / DC_660) of 0.024.
The normalized infrared pulsation (AC_940 / DC_940) measures 0.048.
The modulation ratio R is 0.024 / 0.048 = 0.50.
Because tissue scatters light, microprocessors convert R to SpO2 using empirical calibration curves from healthy volunteers, approximated linearly across standard ranges as SpO2 ≈ 110 − 25 × R. For R = 0.50, estimated saturation is SpO2 ≈ 110 − (25 × 0.50) = 97.5%, displayed as 97% or 98%. When deoxygenated blood accumulates, red absorption rises, pushing R to 1.0 at 85% SpO2.
Visualizing how light waves attenuate through absorbing media can be challenging. The Fermi Simulation Lab provides interactive simulations for ideas that are easier to see than to read, helping learners explore optical absorption and wave dynamics. For learners linking wave physics to human physiology, the Fermi Concept Library maps every concept in physics and biology, each with its own dedicated lesson.
What causes inaccurate pulse oximeter readings?
Several physical and physiological factors can distort optical readings:
Poor peripheral perfusion: During hypothermia, shock, or vasoconstriction, peripheral pulse amplitude falls near electronic noise levels, causing readings to freeze or drop out.
Dyshaemoglobins: Standard devices assume only normal haemoglobins exist. In carbon monoxide poisoning, carboxyhaemoglobin absorbs 660 nm light similarly to oxyhaemoglobin. As Jubran notes in Critical Care, oximeters misread carboxyhaemoglobin as oxyhaemoglobin, giving false readings of 98% to 100%.
Cosmetic pigments: Dark nail polishes (black, navy, or dark green) absorb 660 nm and 940 nm light, impeding transmission and triggering spurious desaturations.
Skin pigmentation: Epidermal melanin absorbs light across visible and near-infrared bands. A study led by Michael Sjoding in the New England Journal of Medicine examined 10,789 paired measurements across 1,609 hospital patients. Black patients experienced occult hypoxaemia—arterial blood gas saturation below 88% despite an oximeter reading of 92% to 96%—nearly three times as often as White patients (11.7% versus 3.6%).
How do you ensure an accurate pulse oximeter reading?
To ensure optical measurements reflect true physiology, clinical protocols in the World Health Organization Pulse Oximetry Training Manual recommend standard operating steps:
Prepare the site: Use a warm, clean finger. Remove dark polish, or place the probe on an unvarnished digit or earlobe.
Rest before measuring: Sit quietly for at least 5 minutes. Keep the hand resting below heart level to reduce venous pooling.
Separate from blood pressure cuffs: Do not attach the sensor to an arm with an automated cuff, which blocks arterial flow during inflation.
Confirm pulse tracking: Check the plethysmographic bar for 20 to 30 seconds until the pulse indicator synchronizes with the heartbeat.
Reference clinical thresholds:
95% to 100%: Normal resting saturation at sea level.
94% or below: Indicates hypoxaemia requiring medical evaluation.
Below 90%: Defined as a clinical emergency requiring immediate intervention.


