

On this page
When you study alternating current (AC) in Class 12, the series LCR circuit brings together everything you have learned about resistors, inductors and capacitors. Instead of memorising the final formulas, learning how to derive the impedance (Z) and resonance frequency from a phasor diagram gives you a reliable tool for board exams, JEE and NEET.
Here is the step-by-step derivation using the phasor method, the Pythagoras step for impedance, and the condition for resonance.
How do you draw the LCR phasor diagram?
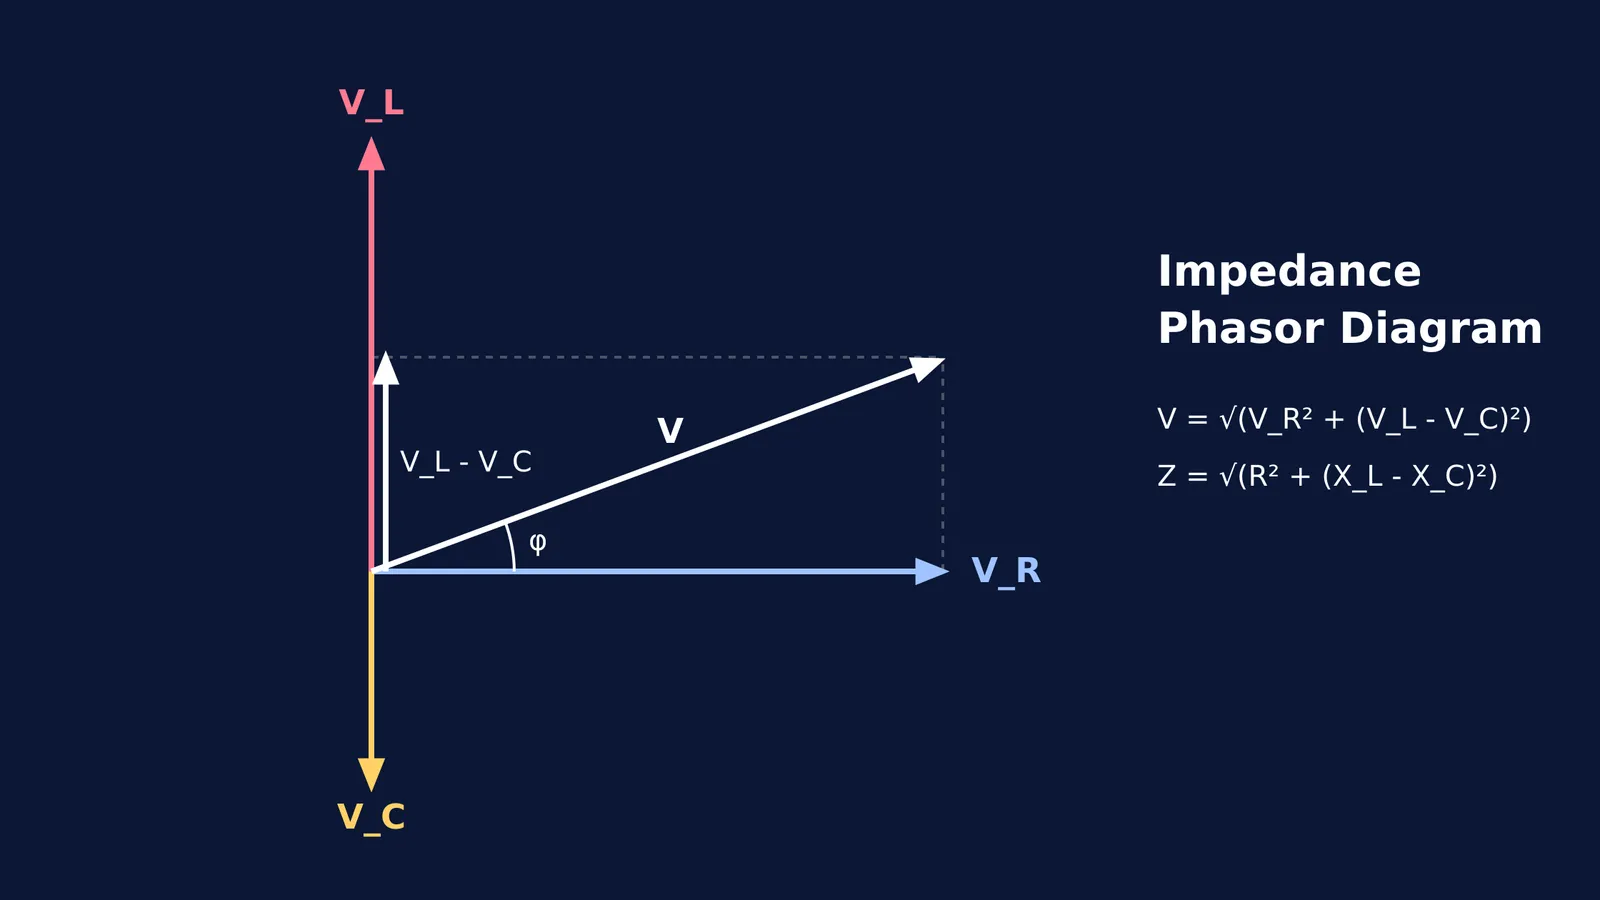
In a series circuit, the same current (I) flows through the resistor (R), the inductor (L) and the capacitor (C). We use this current as our reference on the horizontal axis of the phasor diagram.
The voltages across each component behave differently:
Voltage across the resistor (V_R): This is in phase with the current, so we draw it along the horizontal axis.
Voltage across the inductor (V_L): This leads the current by 90°, so we draw it pointing straight up.
Voltage across the capacitor (V_C): This lags the current by 90°, so we draw it pointing straight down.
Because V_L and V_C are exactly opposite to each other on the vertical axis, we can find their net effect by subtraction. If the inductor's voltage is higher, the net reactive voltage is V_L - V_C, pointing upwards.
If you find visualising these phase differences tricky, the Fermi Concept Library has a lesson for every concept in physics, each with its place in the map, so you never have to guess which way the arrows point.
What is the Pythagoras step for impedance (Z)?
The total voltage (V) of the circuit is the vector sum of V_R and the net reactive voltage (V_L - V_C). Because they sit at a right angle to each other, they form a right-angled triangle where the total voltage is the hypotenuse.
Using Pythagoras' theorem: V² = V_R² + (V_L - V_C)² V = √(V_R² + (V_L - V_C)²)
We know from Ohm's law that voltage equals current multiplied by opposition. For the resistor, V_R = I × R. For the inductor, V_L = I × X_L (where X_L is the inductive reactance). For the capacitor, V_C = I × X_C (where X_C is the capacitive reactance).
Substitute these into the equation: V = √((I × R)² + (I × X_L - I × X_C)²) V = I × √(R² + (X_L - X_C)²)
Impedance (Z) is defined as the total opposition to current in the circuit, which is V / I. Dividing both sides by I gives the final impedance formula: Z = √(R² + (X_L - X_C)²)
What is the condition for resonance frequency?
NCERT Class 12 Physics states that resonance in a series LCR circuit occurs when the impedance reaches its minimum value and the current becomes maximum.
Looking at our formula Z = √(R² + (X_L - X_C)²), the impedance is smallest when the bracketed term is zero. This happens when the inductive reactance exactly equals the capacitive reactance: X_L = X_C
At this point, Z = √(R² + 0) = R. The circuit becomes purely resistive.
To find the frequency where this happens, we substitute the formulas for reactance. We know X_L = ωL and X_C = 1 / (ωC), where ω is the angular frequency. ωL = 1 / (ωC) ω² = 1 / (LC) ω = 1 / √(LC)
Since angular frequency ω = 2πf, we can write: 2πf = 1 / √(LC) f = 1 / (2π√(LC))
This is the resonant frequency. If you want to see how the current peaks at exactly this frequency, you can read our guide on the RLC AC resonance simulation.
How do you calculate resonance frequency in a worked example?
If a circuit has an inductor of L = 2 H and a capacitor of C = 18 μF (which is 18 × 10⁻⁶ F), what is its resonant frequency?
Write down the values in standard SI units: L = 2 H, C = 18 × 10⁻⁶ F
Multiply them together: L × C = 36 × 10⁻⁶
Find the square root: √(LC) = 6 × 10⁻³
Multiply by 2π (using π ≈ 3.14): 2π√(LC) ≈ 2 × 3.14 × 6 × 10⁻³ = 37.68 × 10⁻³
Take the reciprocal: f = 1 / (37.68 × 10⁻³) ≈ 26.5 Hz
When practising these numericals, it is easy to make a small arithmetic error and get stuck. Fermi's AI tutor works out what you already know, builds a plan for the session, and teaches through it with a step-by-step solver that explains the reasoning rather than printing an answer. For more on how these graphs change, see our breakdown of reactance vs frequency graphs.


