

On this page
In an alternating current (AC) circuit, inductors and capacitors offer a kind of resistance called reactance. But unlike a standard resistor, their opposition to current changes dynamically depending on how fast the current alternates.
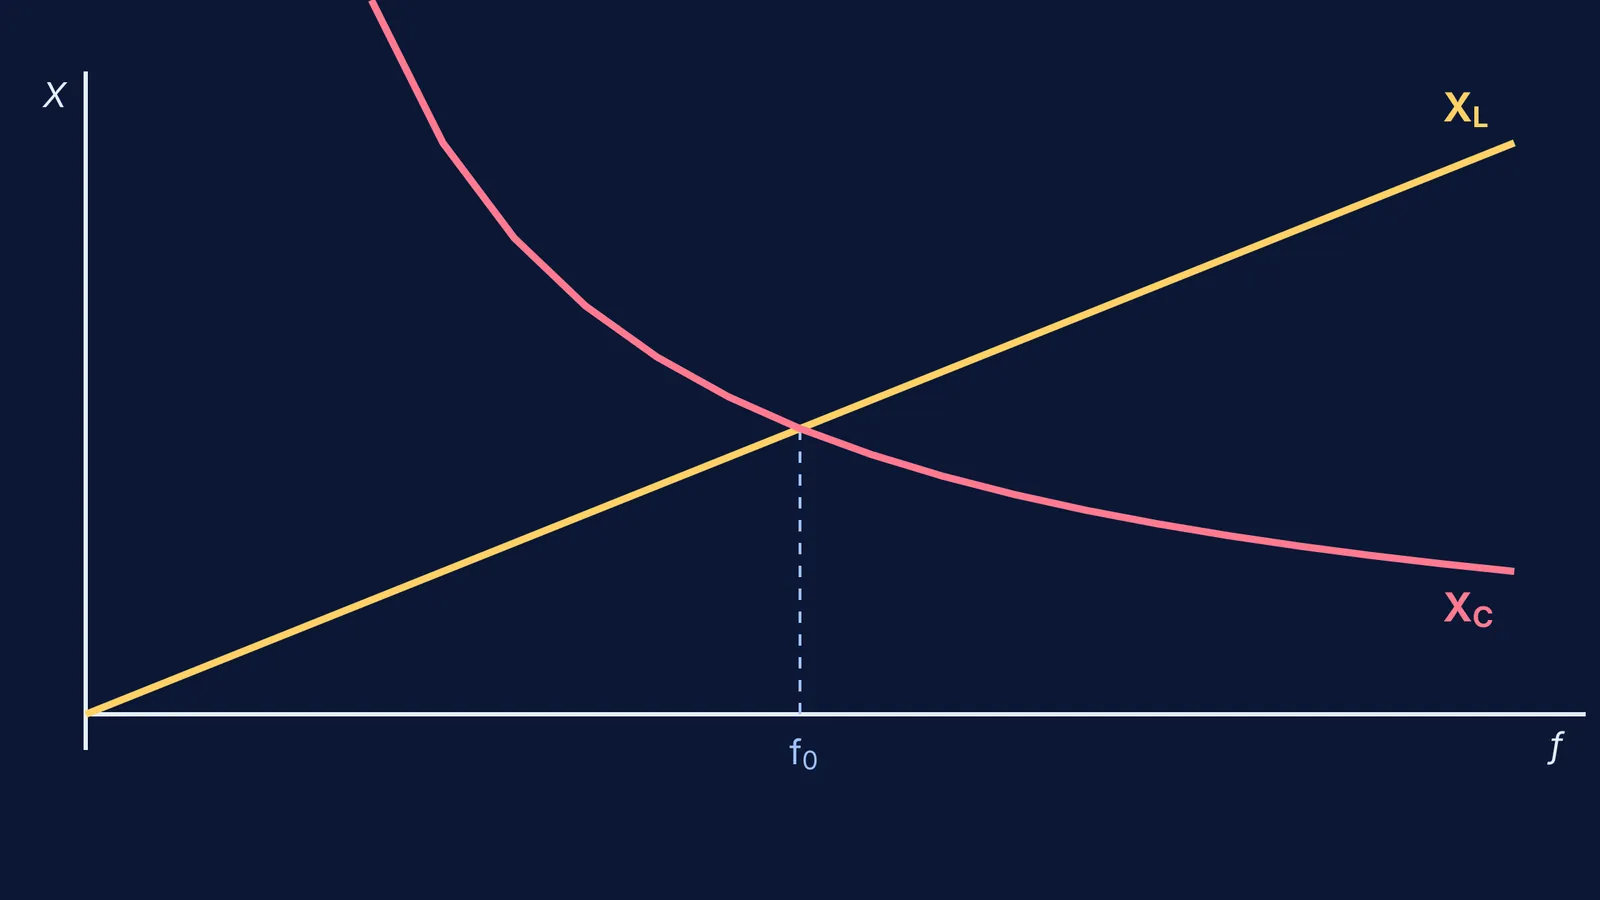
If you map this behaviour, you get the reactance versus frequency graphs. These two curves are exact mirrors of each other's behaviour. Knowing how to draw them, and where they meet, is the key to solving circuit problems and understanding how radios and filters tune into specific signals.
What is the inductive reactance vs frequency graph?
An inductor fights changes in current. The faster the AC voltage pushes back and forth, the harder the inductor pushes back.
Inductive reactance (X_L) is calculated as X_L = 2πfL, where f is the frequency in hertz and L is the inductance in henries. Because X_L is directly proportional to frequency, the graph of inductive reactance versus frequency is a straight line passing through the origin (OpenStax Volume 2).
This means that at a frequency of zero (which is direct current, or DC), an ideal inductor has zero reactance and acts like a simple wire. As the frequency climbs, the straight line goes up at a constant slope. A larger inductance produces a steeper slope, meaning it chokes off high-frequency currents much faster.
What is the capacitive reactance vs frequency graph?
A capacitor behaves in the exact opposite way. It stores charge on its plates, and a slow-moving, low-frequency current gives it plenty of time to fill up and block the flow.
Capacitive reactance (X_C) is calculated as X_C = 1 / (2πfC), where C is the capacitance in farads. Because frequency sits in the denominator, X_C is inversely proportional to frequency, making its graph a rectangular hyperbola that curves smoothly downward (OpenStax Volume 2).
At a frequency of zero (DC), the curve climbs towards infinity, which means the capacitor acts as an open switch and blocks the current entirely. As the frequency increases, the capacitor has less time to charge up before the AC voltage reverses direction, so its opposition to the current drops closer and closer to zero.
At what frequency do the graphs cross?
If you draw both curves on the same axes, the straight line of the inductor and the hyperbola of the capacitor will intersect at exactly one point.
This crossing point is called the resonant frequency (f_0). At this specific frequency, the inductive reactance perfectly equals the capacitive reactance (X_L = X_C). Because they act in opposite directions—voltage leads current by 90° in an inductor, but lags by 90° in a capacitor—their reactances cancel each other out completely. The circuit's total impedance reaches its absolute minimum value, leaving only the pure resistance of the wires and components (OpenStax Volume 2).
You can find the formula for this crossing point by setting the two equations equal to each other: 2πfL = 1 / (2πfC)
Rearranging to solve for f gives the standard resonant frequency formula: f_0 = 1 / (2π√(LC))
Worked example: Finding the crossing point
Knowing the shape of the graphs is useful, but exam questions often ask you to calculate exactly where they intersect. Here is how to run the numbers without getting tangled in standard form.
Suppose you have an inductor of L = 10 mH (10 × 10⁻³ H) and a capacitor of C = 10 μF (10 × 10⁻⁶ F) connected in a circuit.
Start with the resonant frequency equation: f_0 = 1 / (2π√(LC))
Multiply L and C: (10 × 10⁻³) × (10 × 10⁻⁶) = 10 × 10⁻⁸ H·F
Take the square root: √(10 × 10⁻⁸) = √10 × 10⁻⁴ (since √10 is roughly 3.16, this is 3.16 × 10⁻⁴)
Calculate the frequency: f_0 = 1 / (2π × 3.16 × 10⁻⁴)
Finish the arithmetic: f_0 ≈ 1 / 0.001985 ≈ 504 Hz
At exactly 504 Hz, the straight line and the hyperbola cross, and the reactances perfectly cancel.
If you are struggling to picture how voltage and current shift out of phase in AC circuits, the Fermi Concept Library breaks down each idea with its own lesson. When you need to see these phase shifts in motion, the Fermi Simulation Lab provides interactive simulations for the ideas that are easier to see than to read.
When you practice, remembering the shape of these two graphs is a powerful shortcut. If you know that inductors rise and capacitors fall, you can verify your own answers for high-frequency or low-frequency limits without touching a calculator. For more circuit techniques, see our guides on the node potential method and how to handle an inductor switch at t=0 and infinity.


