

On this page
Most cardiac output questions in Class 11 and NEET-UG biology use the same three numbers: stroke volume, heart rate and the length of one cardiac cycle. Below are the formulas, the textbook values, how to read heart rate off an ECG strip, and a worked example.
What is cardiac output and how do you calculate it?
Cardiac output is the volume of blood pumped out by each ventricle per minute, according to NCERT's Class 11 biology chapter Body Fluids and Circulation.
The formula is one line: cardiac output = stroke volume × heart rate.
NCERT puts the stroke volume at about 70 mL and the average heart rate at 72 beats per minute, and says cardiac output averages 5,000 mL, or 5 litres, a minute in a healthy person (NCERT, Chapter 15). Check it yourself: 70 mL × 72 = 5,040 mL a minute, which rounds to 5 litres. The chapter adds that the body can change both stroke volume and heart rate, and that an athlete's cardiac output is much higher than an ordinary person's.
Two traps: cardiac output is per ventricle, so do not double it, and mL per beat × beats per minute gives mL per minute, so divide by 1,000 for litres.
How do you find stroke volume?
Stroke volume is the end-diastolic volume (EDV) minus the end-systolic volume (ESV), as physiologist Richard Klabunde writes on CV Physiology. That is, the blood in the full ventricle minus what is left after it contracts.
Klabunde's typical values are an EDV of about 120 mL and an ESV of about 50 mL, which gives a stroke volume of 70 mL (CV Physiology). That matches the NCERT figure. If a question asks for ejection fraction, it is stroke volume ÷ EDV × 100 (CV Physiology).
How do you get heart rate from an ECG?
NCERT notes that you can find someone's heart rate by counting how many QRS complexes appear in a given time (NCERT, Chapter 15). For numericals, the grid on the paper does the timing for you.
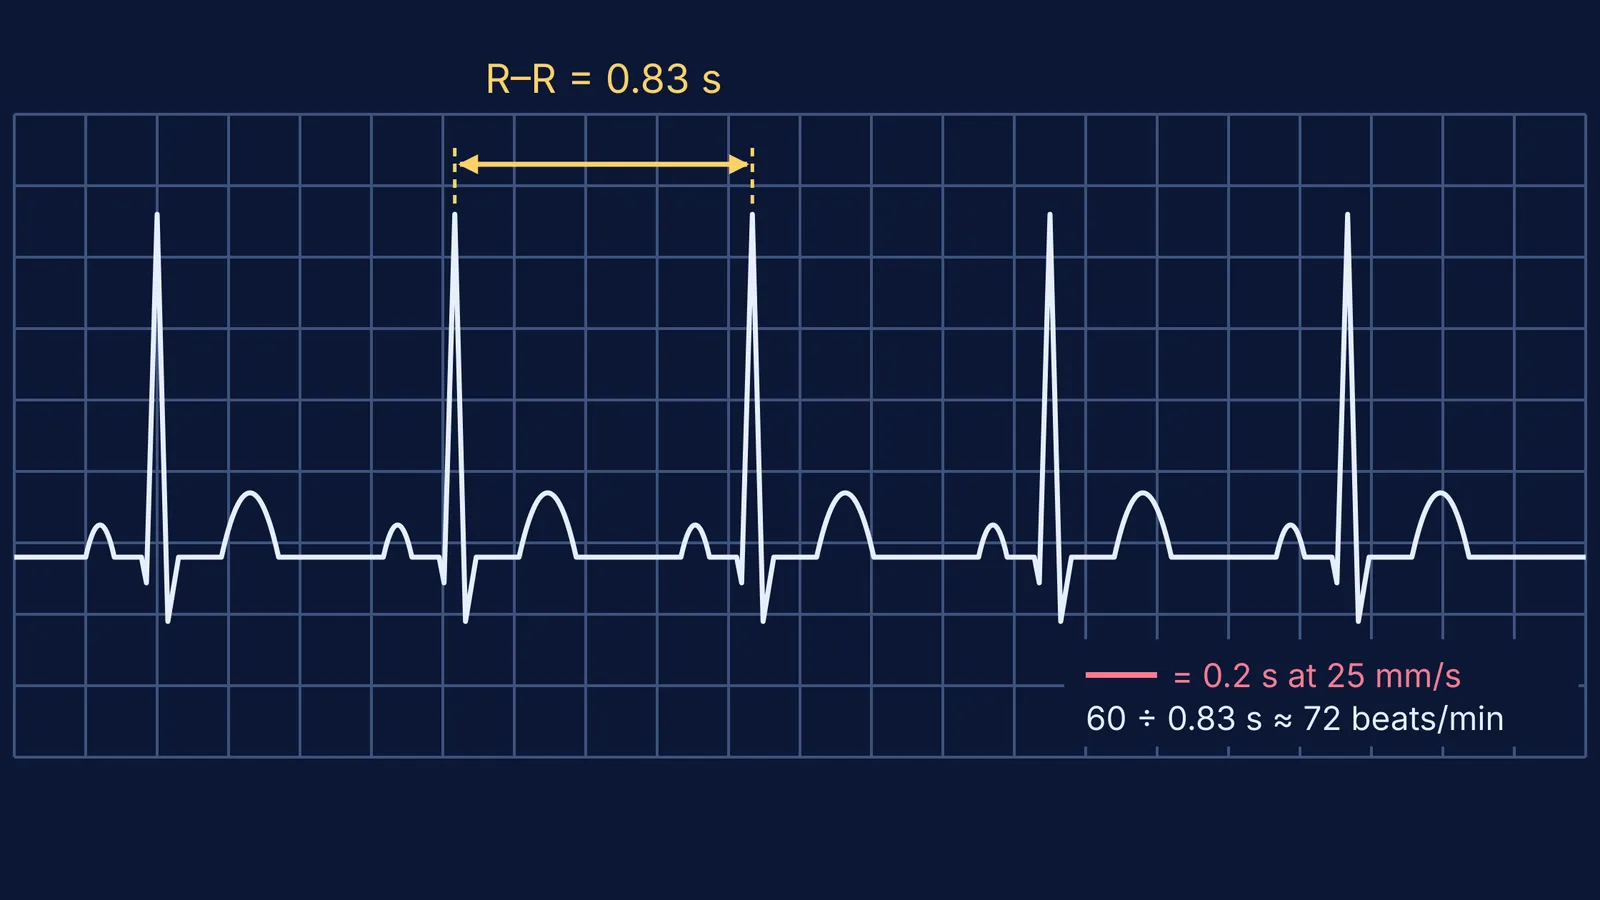
At the standard paper speed of 25 mm per second, one small square (1 mm) is 0.04 s, one large square is 0.2 s and five large squares make one second (LITFL, Cadogan and Buttner). From there you get three methods:
Large squares: heart rate = 300 ÷ number of large squares between two R waves.
Small squares: heart rate = 1,500 ÷ number of small squares between two R waves.
Counting: for slow or irregular rhythms, count the R waves on a 10-second strip and multiply by 6.
CV Physiology gives the same two square rules. All three come from one idea: heart rate = 60 ÷ (R–R interval in seconds). The 300 comes from 60 ÷ 0.2, and the 1,500 from 60 ÷ 0.04.
These are textbook calculations for exam questions, not a way to read a real patient's ECG.
Where does the 0.8-second cardiac cycle come from?
One cardiac cycle is one round of systole and diastole of the atria and ventricles. At 72 cycles a minute, NCERT works out a cycle length of 0.8 seconds (NCERT, Chapter 15). Strictly, 60 ÷ 72 is 0.83 s, so the book's 0.8 s is a rounded figure.
The ECG ties this together: the R–R interval is the length of one cardiac cycle. In the trace above, the R waves are 0.83 s apart, which is 72 beats per minute. For the valve openings and heart sounds inside each cycle, see our notes on body fluids and circulation, the cardiac cycle and the ECG.
A worked example: from ECG strip to cardiac output
Say a question gives you an ECG recorded at 25 mm/s with 4 large squares between R waves. The ventricle holds 120 mL at the end of diastole and 50 mL at the end of systole.
Heart rate: 300 ÷ 4 = 75 beats per minute. As a check, 4 large squares are 20 small ones, and 1,500 ÷ 20 = 75.
Cycle length: 60 ÷ 75 = 0.8 s, the same as 4 × 0.2 s.
Stroke volume: 120 − 50 = 70 mL.
Cardiac output: 70 mL × 75 = 5,250 mL a minute, or 5.25 litres a minute.
Sense check: is the answer close to the 5 litres a minute in NCERT's chapter? It is, so the units are probably right.
If the terms are shaky (what EDV means, which wave is the QRS), the Fermi Concept Library has a lesson on each biology concept. If the numbers keep going wrong, the Fermi Problem Library has worked problems with a step-by-step solver that explains the reasoning rather than printing an answer.
For the history behind the numbers, read how Willem Einthoven's string galvanometer made the ECG possible and how Sunao Tawara found the atrioventricular node that passes each beat from the atria to the ventricles.


