On this page
When you study photosynthesis in higher plants, two graphs almost always appear side by side: the absorption spectrum and the action spectrum. They look similar, with twin peaks and a deep trough in the middle, but they plot entirely different things.
Understanding what each graph measures, and why they don't overlap perfectly, is a core part of the Class 11 and NEET biology syllabus. It is not just about memorising facts; it is about reading the data that proves how plants feed the world.
What does the absorption spectrum show?
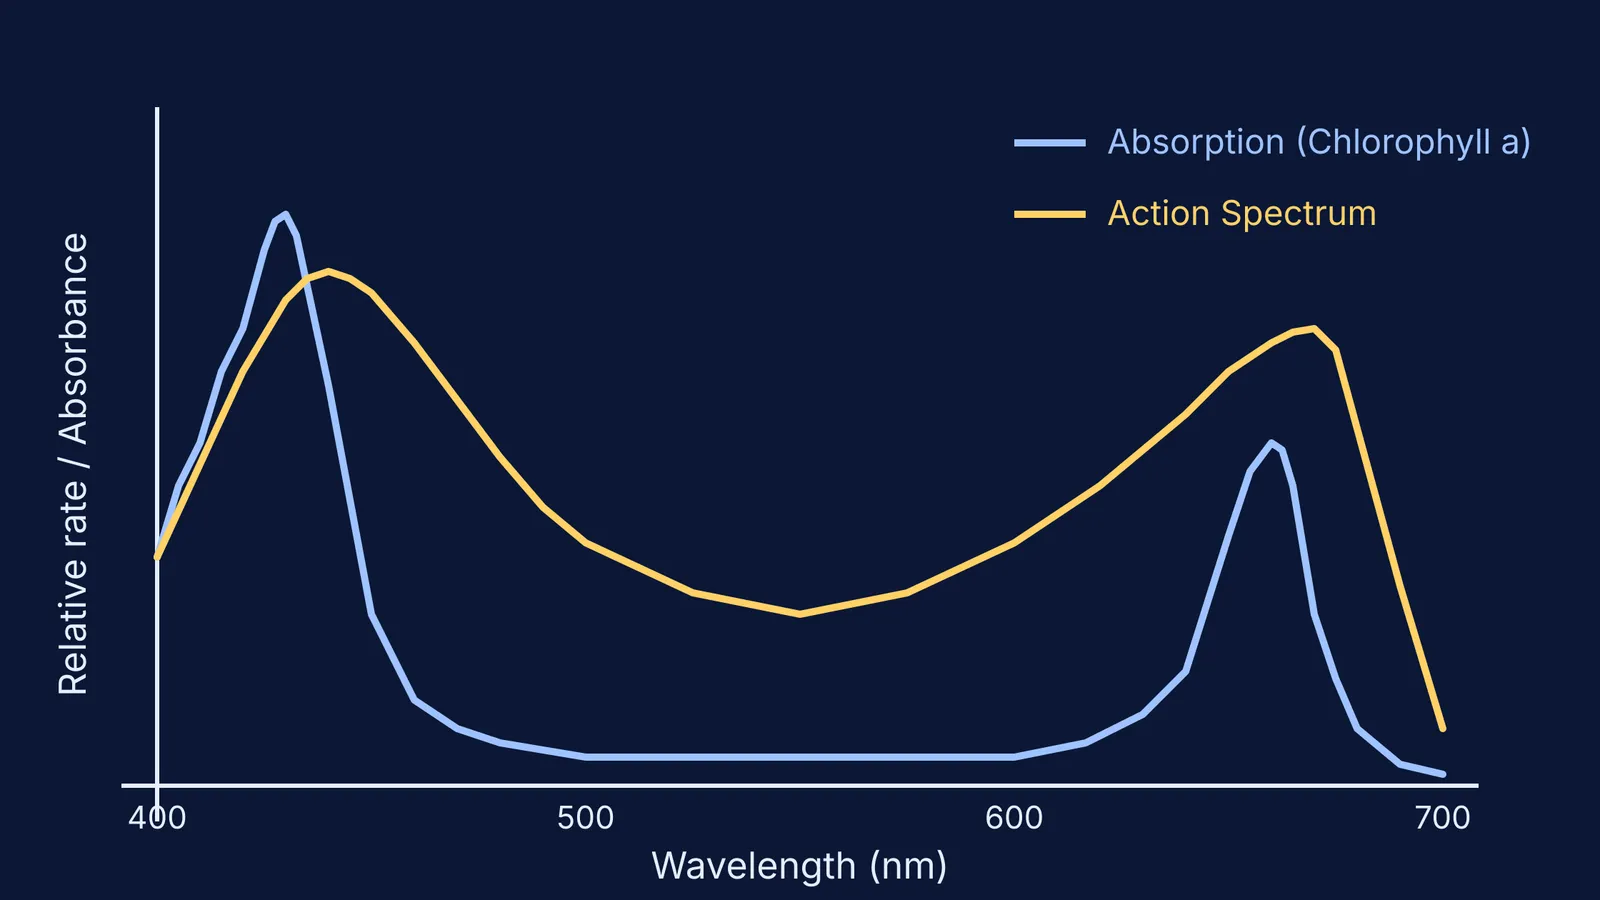
An absorption spectrum is a graph plotting the amount of light energy absorbed by a specific pigment against the wavelength of light.
Leaves contain several pigments, but chlorophyll *a* is the chief one. If you extract chlorophyll *a* and measure its absorbance with a spectrophotometer, you will see it shows maximum absorption in the blue and red regions of the visible spectrum. It absorbs very little in the green region, which is why it reflects green light back to our eyes, giving leaves their characteristic colour.
However, a plant does not rely on chlorophyll *a* alone. Accessory pigments like chlorophyll *b*, xanthophylls, and carotenoids have their own distinct absorption spectra. They peak at slightly different wavelengths, allowing the plant to cast a wider net for incoming sunlight.
What is the action spectrum of photosynthesis?
While the absorption spectrum tells you what light a pigment *catches*, the action spectrum tells you what the plant *does* with it. It is a graph showing the effectiveness of different wavelengths of light in driving the entire process of photosynthesis.
Instead of measuring absorbance, the action spectrum plots the rate of photosynthesis — usually measured by how fast oxygen is released or how quickly carbon dioxide is consumed by the plant.
The very first action spectrum was ingeniously plotted in 1882 by Theodor W. Engelmann. He used a simple prism to split white light across a filament of green algae. Because he lacked modern electronic sensors to measure oxygen, he used oxygen-seeking (aerobic) bacteria as tiny biological detectors. When he looked through his microscope, he saw the bacteria had clustered densely in the blue and red regions of the spectrum. This elegantly proved that those specific wavelengths drove the highest rates of oxygen production.
Why don't the two curves overlap perfectly?
If you take the action spectrum of photosynthesis and overlay it onto the absorption spectrum of chlorophyll *a*, you will notice that their peaks line up perfectly in the blue and red zones. This alignment is the ultimate proof that chlorophyll *a* is the primary pigment responsible for trapping light energy.
However, if you look closely, the action spectrum is wider and "fatter", particularly in the blue-green and yellow-orange regions where chlorophyll *a* is nearly blind.
This extra width comes entirely from the accessory pigments. They absorb light in the intermediate regions where chlorophyll *a* is inefficient and physically transfer that trapped energy directly to the main reaction centre. Without accessory pigments, plants would waste a large portion of the visible light spectrum that filters through the atmosphere. In addition to transferring energy, these accessory pigments also protect chlorophyll *a* from photo-oxidation, a destructive process caused by excess light.
Tackling spectrum questions in your exams
In past NEET papers and board exams, you will often see a complex figure containing three overlapping absorption curves (usually for chlorophyll *a*, chlorophyll *b*, and carotenoids) with one overarching action spectrum curve layered on top.
A common multiple-choice question asks you to identify the chief pigment from these unlabelled lines. The correct logic is always to look for the single absorption curve that most closely traces the peaks of the overall action spectrum — which is chlorophyll *a*. You might also be asked about the role of the other pigments in the plant kingdom, which is specifically to broaden the range of light the leaf can utilise for photosynthesis.
If you are stuck on a confusing graph in a past paper or your textbook, you can bring it to the Fermi Problem Library. Instead of just printing an answer key that you have to memorise, Fermi's AI tutor works through the problem alongside you, helping you read the axes, match the peaks, and build the logic step-by-step. To review the entire Z-scheme and see exactly how energy flows from those accessory pigments to the reaction centre, you can trace the process in the Fermi Concept Library.